. 2011 Jan 26:8:39.
doi: 10.1186/1743-422X-8-39.

Japanese encephalitis Virus wild strain infection suppresses dendritic cells maturation and function, and causes the expansion of regulatory T cells

Affiliations

Japanese encephalitis Virus wild strain infection suppresses dendritic cells maturation and function, and causes the expansion of regulatory T cells

Shengbo Cao et al. Virol J. .

Abstract

Background: Japanese encephalitis (JE) caused by Japanese encephalitis virus (JEV) accounts for acute illness and death. However, few studies have been conducted to unveil the potential pathogenesis mechanism of JEV. Dendritic cells (DCs) are the most prominent antigen-presenting cells (APCs) which induce dual humoral and cellular responses. Thus, the investigation of the interaction between JEV and DCs may be helpful for resolving the mechanism of viral escape from immune surveillance and JE pathogenesis.

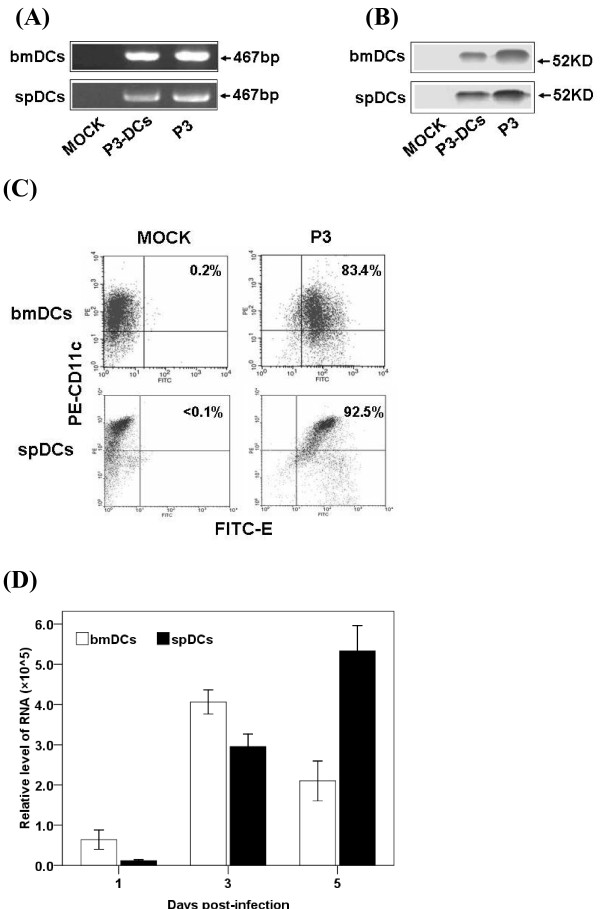
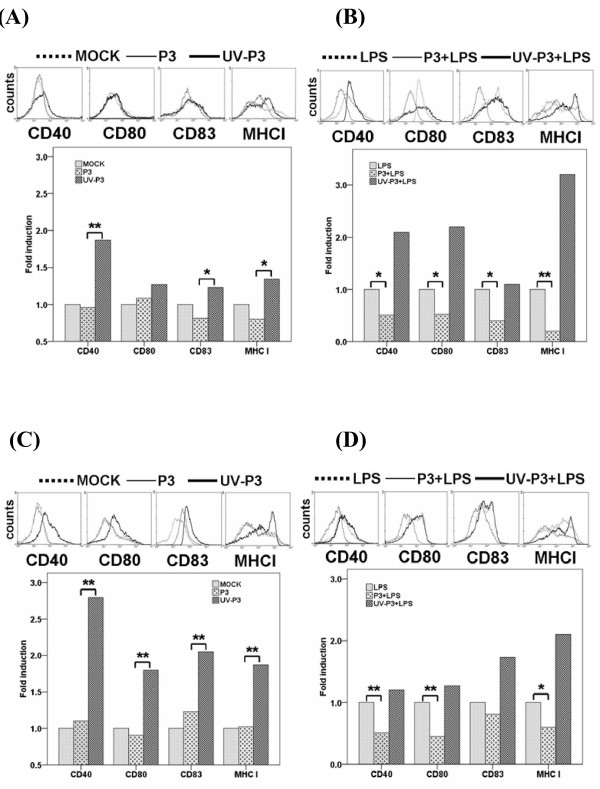
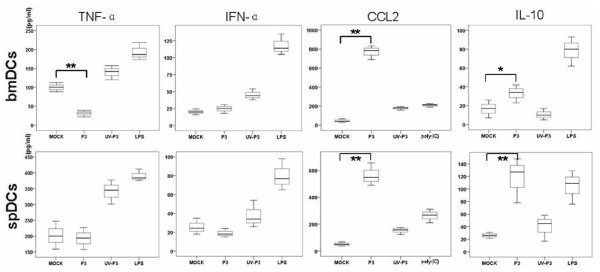
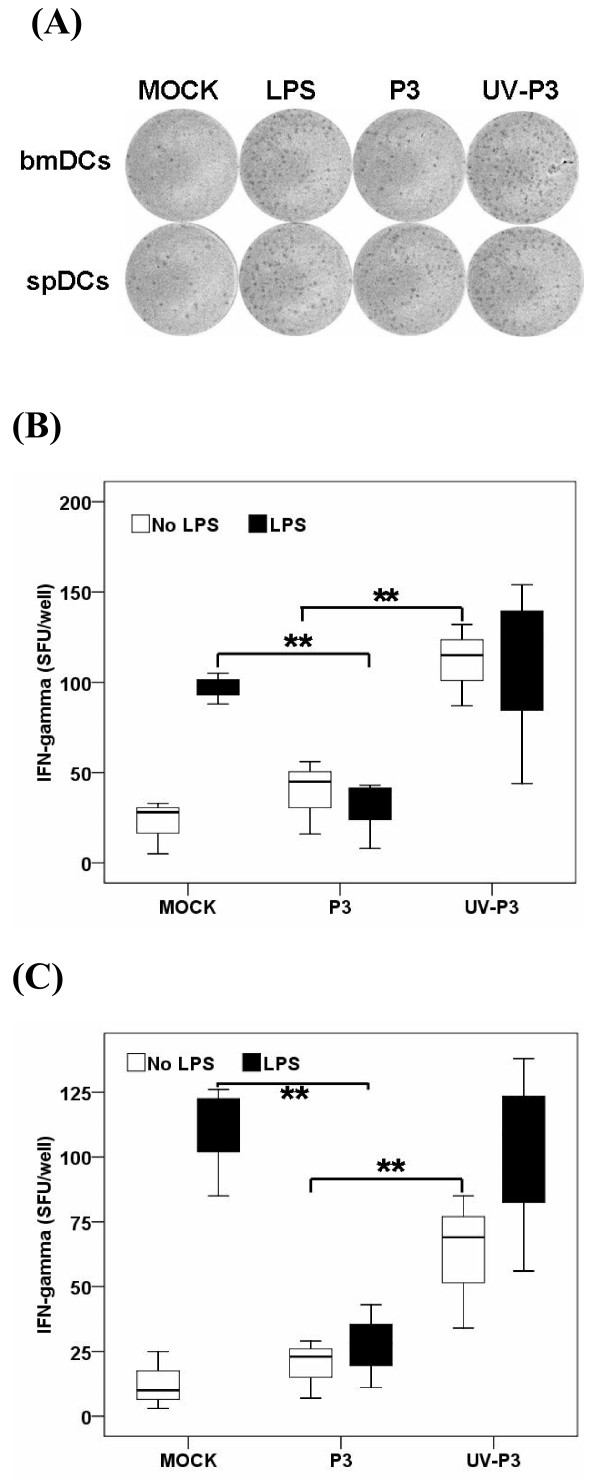
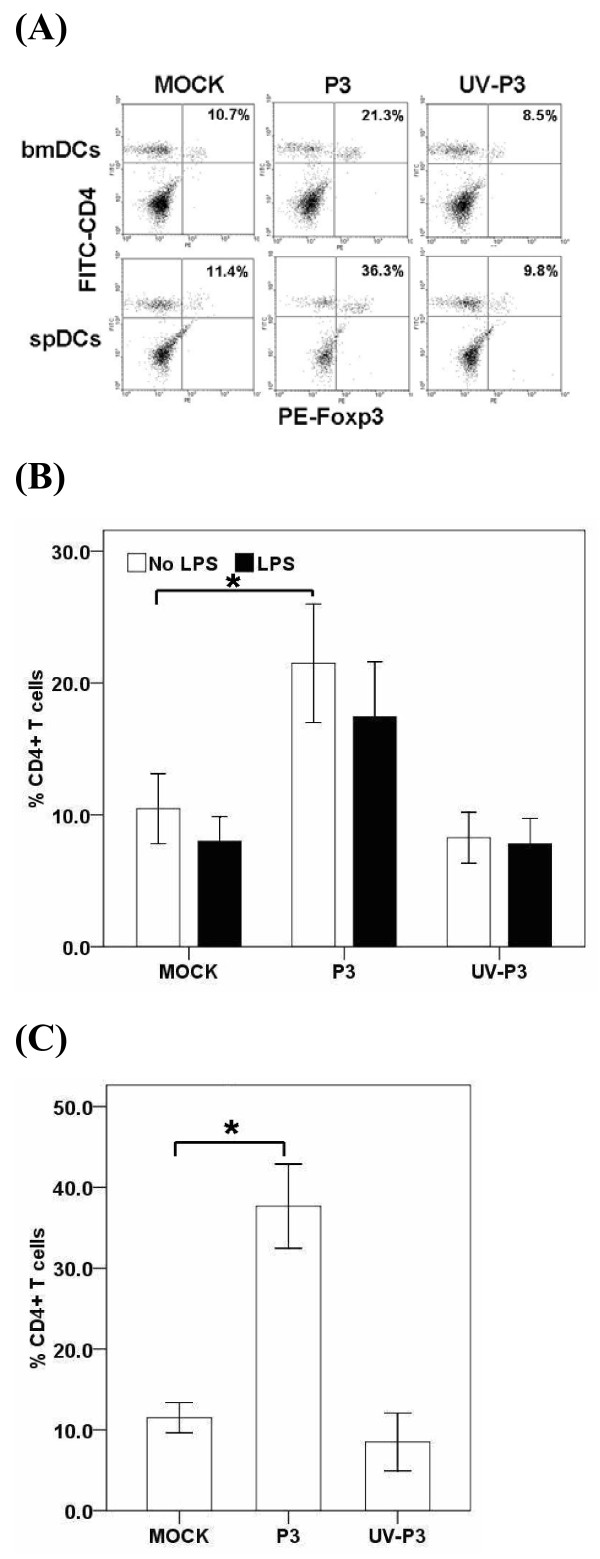
Results: We examined the alterations of phenotype and function of DCs including bone marrow-derived DCs (bmDCs) in vitro and spleen-derived DCs (spDCs) in vivo due to JEV P3 wild strain infection. Our results showed that JEV P3 infected DCs in vitro and in vivo. The viral infection inhibited the expression of cell maturation surface markers (CD40, CD80 and CD83) and MHCⅠ, and impaired the ability of P3-infected DCs for activating allogeneic naïve T cells. In addition, P3 infection suppressed the expression of interferon (IFN)-α and tumor necrosis factor (TNF)-α but enhanced the production of chemokine (C-C motif) ligand 2 (CCL2) and interleukin (IL)-10 of DCs. The infected DCs expanded the population of CD4+ Foxp3+ regulatory T cell (Treg).

Conclusion: JEV P3 infection of DCs impaired cell maturation and T cell activation, modulated cytokine productions and expanded regulatory T cells, suggesting a possible mechanism of JE development.


Figures

Figure 1
Figure 1
P3 infects DCs in vitro and in vivo. (A) The in vitro infected bmDCs and the spDCs from P3-challenged mice were harvested and analyzed with RT-PCR. Bands shown are 467-bp PCR products specific for JEV. (B) The bmDCs and spDCs were analyzed for E protein (JEV envelope protein) by separation of the proteins on a 10% SDS-PAGE gel followed by electrotransfer to NC membranes and incubation with monoclonal antibodies against E protein. (C) The bmDCs were harvested after 3 days infection and the spDCs were isolated from mice which had been challenged for 5 days. 1 × 10⁵ bmDCs or spDCs were doubly stained with FITC-anti-E and PE-anti-CD11c and analyzed by FACS respectively. (D) The infected bmDCs and the spDCs from challenged mice were collected 3 times at day 1, 3 and 5, and a real-time PCR was performed to quantitatively detect RNA copies of JEV. Each point represents the mean ± SD determinants in triplicate.
Figure 2
Figure 2
Effects of P3 infection on DCs maturation. 1 × 10⁵ freshly purified bmDCs were left mock-treated or treated with 1 MOI of P3 or UV-P3 with or without LPS (lipopolysacchide, Sigma-Aldrich, MO) for 3 days. The spDCs from mice, which have been challenged or immunized for 5 days, were obtained and treated with or without LPS. Expressions of CD40, CD80, CD83 and MHCⅠ of the bmDCs (A,B) or spDCs (C,D) were evaluated by FACS. Relative fluorescence intensity to mock group (fold induction) was expressed as the means ± SD of triplicates. *, P < 0.05; **, P < 0.01.
Figure 3
Figure 3
Cytokine profiles of P3-infected DCs (IFN-α, TNF-α, CCL2 and IL-10). 1 × 10⁵ freshly purified bmDCs were left mock-treated or treated with 1 MOI of P3 or UV-P3 for 3 days. The spDCs from mice, which were challenged or immunized for 5 days, were obtained and cultured for 3 days. The cell supernatants harvested at 3 days of post infection were analyzed with ELISA to measure the concentrations of cytokines (IFN-α, TNF-α, CCL2 and IL-10). Cytokine concentrations were expressed as the means ± SD of triplicates. *, P < 0.05; **, P < 0.01.
Figure 4
Figure 4
Effects of P3 infection on DCs activation of naïve T cells by MLR. Mock-treated, P3-infected or UV-P3-stimulated DCs as well as differently treated spDCs were added in grade dose to 1 × 10⁵ allogeneic T cells at the indicated stimulator-responder ratios in triplicate, with (B) or without (A) LPS treatment for 20 h before the addition of 50 μl of CellTiter 96® AQueous One Solution Cell Proliferation Assay. The bmDCs, spDCs as well as T cells were served as spontaneous NADH/NADPH releases controls respectively. The presentation activities of differently treated bmDCs were measured as 100% (OD490DC+T exp.-OD490DC spont.-OD490T spont.)/(OD490T spont.). Results were expressed as the means ± SD of triplicates. *, P < 0.05.
Figure 5
Figure 5
IFN-γ producing T cells were detected by ELISPOT assay. P3-infected, UV-P3-stimulated or mock-treated DCs as well as differently treated spDCs were harvested and treated with Mitomycin C (Sigma-Aldrich, MO) at final concentration of 10 μg/ml for 1 h. The differently treated or mock DCs were seeded (1 × 10⁴ per well) together with 1 × 10⁵ per well T cells in triplicates for 20 h. LPS-stimulated DC/T cell co-cultures served as positive controls. One representative for IFN-γ spot forming unit (SFU) by ELISPOT assay was shown (A). The figure was representative of three independent experiments. Corrected data (SFU)/well were shown for bmDCs and spDCs activations for naïve T cells to expand and produce IFN-γ by ELISPOT assay (B, in vitro; C, in vivo). Results were expressed as the means ± SD of triplicates. *, P < 0.05.
Figure 6
Figure 6
Effects of P3 infection on DCs-induced differentiation of regulatory T cells. 1 × 10⁵ mock-, P3-, UV-P3- or LPS-treated bmDCs were incubated with 1 × 10⁶ allogeneic naïve T cells for 5 days. T cells were purified and doubly labeled for CD4 and Foxp3, and assessed by FACS. The in vivo Treg in splenocytes were purified and examined by FACS from mice inoculated with 1 × 10⁵ PFU P3 or identical UV-P3 i.p. for 5 days. Representative result was shown from three independent experiments (A). The percentage represented the ratio of CD4+ Foxp3+ cells in CD4+ T cells. P3-infected bmDCs elicited the Treg differentiation in vitro (B). After P3 infection or UV-P3 stimulation of mice i.p., Treg differentiation in vivo was analyzed immediately (C). Results were expressed as the means ± SD of triplicates. *, P < 0.05.

References

    1. Hanna JN, Ritchie SA, Phillips DA, Shield J, Bailey MC, Mackenzie JS, Poidinger M, McCall BJ, Mills PJ. An outbreak of Japanese encephalitis in the Torres Strait, Australia, 1995. Med J Aust. 1996;165:256–260. - PubMed
    1. Sugamata M, Ahmed A, Miura T, Takasu T, Kono R, Ogata T, Kimura-Kuroda J, Yasui K. Seroepidemiological study of infection with West Nile virus in Karachi, Pakinstan, in 1983 and 1985. J Med Virol. 1988;26:243–247. doi: 10.1002/jmv.1890260304. - DOI - PubMed
    1. Khanna N, Agnihotri M, Mathur A, Chaturvedi UC. Neutrophil chemotactic factor produced by Japanese encephalitis virus stimulated macrophages. Clin Exp Immunol. 1991;86:299–303. doi: 10.1111/j.1365-2249.1991.tb05813.x. - DOI - PMC - PubMed
    1. Ravi V, Parida S, Desai A, Chandramuki A, Gourie-Devi M, Grau GE. Correlation of tumor necrosis factor levels in the serum and cerebrospinal fluid with clinical outcome in Japanese encephalitis patients. J Med Virol. 1997;51:132–136. doi: 10.1002/(SICI)1096-9071(199702)51:2<132::AID-JMV8>3.0.CO;2-8. - DOI - PubMed
    1. Singh A, Kulshreshtha R, Mathur A. Secretion of the chemokine interleukin-8 during Japanese encephalitis virus infection. J Med Microbiol. 2000;49:607–612. - PubMed

Publication types

MeSH terms