. 2011 Mar;138(5):861-71.
doi: 10.1242/dev.055236. Epub 2011 Jan 26.

Stage-specific signaling through TGFβ family members and WNT regulates patterning and pancreatic specification of human pluripotent stem cells

Affiliations

Stage-specific signaling through TGFβ family members and WNT regulates patterning and pancreatic specification of human pluripotent stem cells

M Cristina Nostro et al. Development. 2011 Mar.

Erratum in

  • Development. 2011 Apr;138(7):1445
  • Development. 2011 Mar;138(5).doi: 10.1242/dev.065904

Abstract

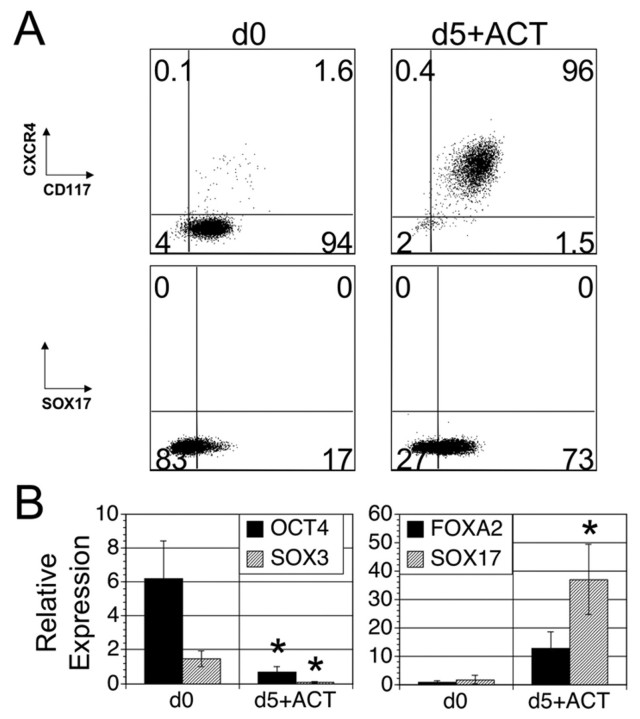
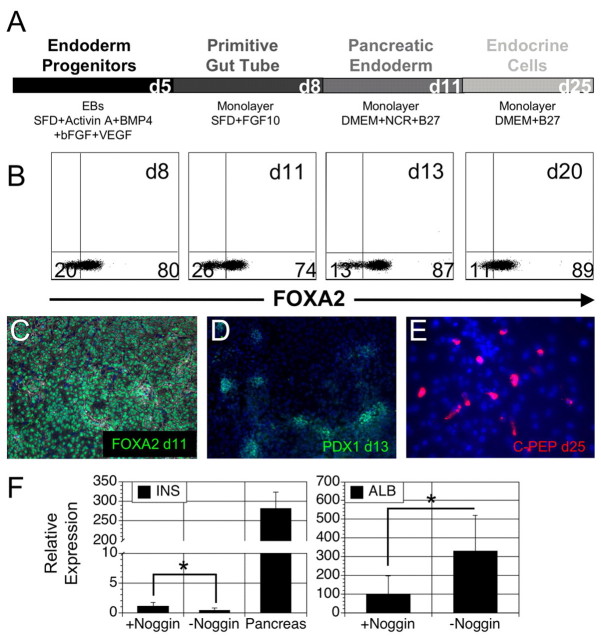
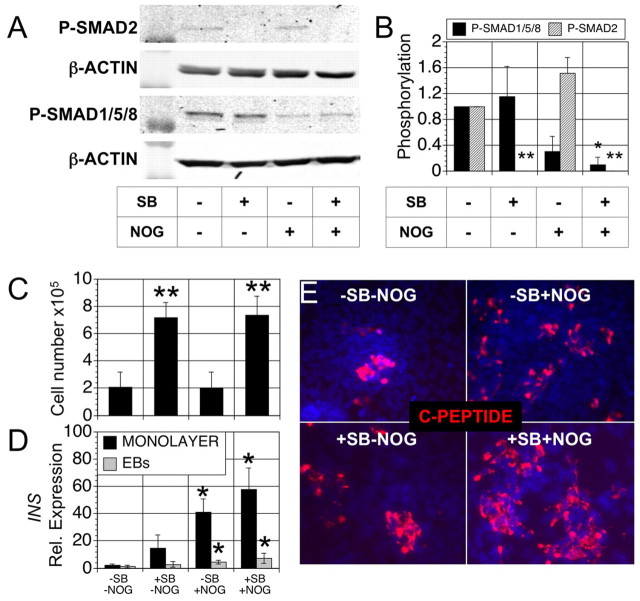
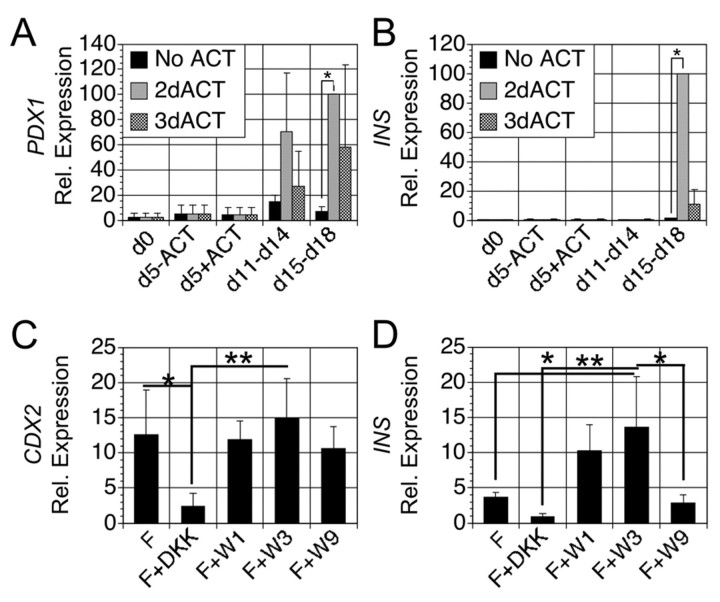
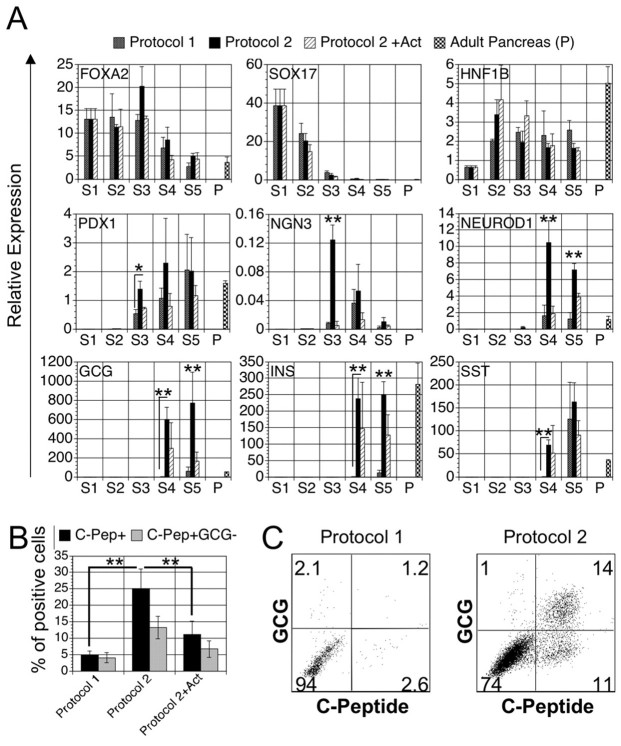
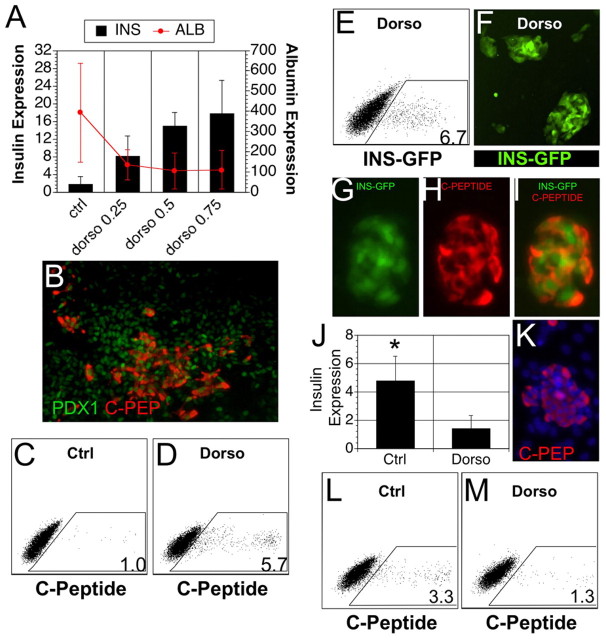
The generation of insulin-producing β-cells from human pluripotent stem cells is dependent on efficient endoderm induction and appropriate patterning and specification of this germ layer to a pancreatic fate. In this study, we elucidated the temporal requirements for TGFβ family members and canonical WNT signaling at these developmental stages and show that the duration of nodal/activin A signaling plays a pivotal role in establishing an appropriate definitive endoderm population for specification to the pancreatic lineage. WNT signaling was found to induce a posterior endoderm fate and at optimal concentrations enhanced the development of pancreatic lineage cells. Inhibition of the BMP signaling pathway at specific stages was essential for the generation of insulin-expressing cells and the extent of BMP inhibition required varied widely among the cell lines tested. Optimal stage-specific manipulation of these pathways resulted in a striking 250-fold increase in the levels of insulin expression and yielded populations containing up to 25% C-peptide+ cells.


Figures

Fig. 1.
Fig. 1.
Endoderm induction in human embryonic stem cell (hESC)-derived embryoid bodies (EBs). (A) Flow-cytometric analysis of CXCR4, CD117 and SOX17 on hESCs [differentiation day (d)0] and d5 EB-derived cells differentiated in the presence of activin (d5+ACT) in serum free media demonstrating efficient induction of endoderm cells using the embryoid body, serum-free differentiation system. Percentage of cells within each quadrant is indicated. (B) Quantitative PCR (QPCR) analysis of OCT4, SOX3, FOXA2 and SOX17 in d0 and d5 populations. Bars represent mean±s.d. Asterisks indicate statistical significance as determined by t-test. P=0.033 (OCT4), P=0.025 (SOX3), P=0.081 (FOXA2) and P=0.030 (SOX17). n=3.
Fig. 2.
Fig. 2.
Generation of pancreatic cells from embryoid body (EB)-derived endoderm. (A) Schematic representation of the differentiation protocol. EBs were trypsinized at differentiation day (d)5 and plated as a monolayer in the presence of FGF10 in SFD media for three days to generate the equivalent of the primitive gut tube. Pancreatic endoderm was subsequently induced by treatment with noggin, KAAD-cyclopamine and retinoic acid (NCR) for 3 days in DMEM supplemented with B27. Cells were then cultured in DMEM supplemented with B27 up to d25 to generate endocrine cells. (B) Intracellular flow-cytometric analysis of FOXA2 at days 8, 11, 13 and 20 of differentiation showing maintenance of FOXA2 expression during this time. Percentage of cells within each quadrant is indicated. (C-E) Immunostaining of FOXA2 at d11, PDX1 at d13 and C-peptide at d25 of differentiation. (F) Quantitative PCR (QPCR) analysis of INS and ALB at d22 in cultures treated with or without noggin at the NCR stage (d8-d10). INS levels are compared with adult pancreas. Bars represent mean±s.d. Asterisks indicate statistical significance as determined by t-test. P=0.025 (INS), P=0.03 (ALB). n=3.
Fig. 3.
Fig. 3.
Inhibition of TGFβ signaling is essential for endocrine lineage commitment. (A) Western blot analysis showing endogenous SMAD2 and SMAD1/5/8 phosphorylation at day 14 of cultures (−SB–NOG, lane 1). Treatment with SB431542 (SB; 6 μM) at day 13 inhibits SMAD2 phosphorylation (+SB, lane 2). Treatment with noggin (NOG; 50 ng/ml) at day 13 inhibits SMAD1/5/8 phosphorylation (+NOG, lane 3). Treatment with SB and noggin at day 13 inhibits SMAD2 and SMAD1/5/8 phosphorylation (+SB+NOG, lane 4). (B) Phospho-SMAD1/5/8 and SMAD2 normalized to β-ACTIN. Bars represent mean±s.d. Asterisks indicate statistical significance as determined by t-test. Treatment with SB (± NOG) inhibits SMAD2 phosphorylation when compared with −SB-NOG (**P=0.0023). Treatment with SB+NOG inhibits SMAD1/5/8 phosphorylation when compared with −SB-NOG (*P=0.018). n=3. (C) Treatment with SB increases cell yield at day 17 of differentiation. Bars represent mean±s.d. Asterisks indicate statistical significance as determined by t-test. P=0.002 (+SB) and P=0.001 (+SB+NOG) compared with −SB–NOG treated group. n=4 for −SB–NOG and +SB–NOG, n=5 for −SB+NOG, n=6 for SB+NOG group. (D) QPCR analysis for INS at day 22 and day 25 of monolayer and embryoid body (EB) differentiation, respectively. Bars represent mean±s.d. Asterisks indicate statistical significance as determined by t-test of NOG treated groups compared with untreated group (−S-N). P<0.05. n=3. (E) Immunostaining for C-peptide at day 17 in the different treatment groups in EB-derived populations.
Fig. 4.
Fig. 4.
Patterning with activin and Wnt3a is required for optimal pancreatic specification. (A,B) Quantitative PCR (QPCR) analysis evaluating PDX1 and INS expression at different stages of differentiation in cultures generated from populations treated without activin (No ACT) at day 5, with activin for 2 days (d5-d7; 2dACT) and with activin for three days (d5-d8; 3dACT). Cultures were treated with SB431542 (SB) and noggin (NOG) following NCR treatment and were terminated at day 15, 17 and 18 for No Act, 2dAct and 3dAct, respectively. Expression levels were normalized to TBP and are relative to the 2dACT sample at d17 (set at 100). Bars represent mean±s.d. Asterisks indicate statistical significance as determined by t-test. P=0.032 (PDX1) and P=0.027 (INS). n=3. (C,D) Day 17 cultures were analyzed by qPCR for the expression of intestinal (CDX2) and pancreatic (INS) genes following treatment with DKK1 or Wnt3a. Bars represent mean±s.d. Cultures were treated between days 7 and 9 with FGF10 (F) or with a combination of FGF10 and one of the following: DKK1 at 150 ng/ml (F+DKK), Wnt3a at 1 ng/ml (F+W1), Wnt3a at 3 ng/ml (F+W3), Wnt3a at 9 ng/ml (F+W9). CDX2 expression was significantly downregulated in F+DKK, INS expression was significantly upregulated in F+W3. *P<0.05, **P<0.01 determined by ANOVA with Tukey's HSD test. n=4.
Fig. 5.
Fig. 5.
Kinetics of pancreatic lineage development. (A) Quantitative PCR (QPCR) analysis for FOXA2, SOX17, HNF1B, NGN3, NEUROD1, GCG, INS and SST in the adult pancreas (P) and at stages 1 to 5 (S1-S5) following differentiation with three different protocols: the D'Amour protocol (D'Amour et al., 2006) supplemented with noggin at stage 3 (protocol 1) and our protocol (protocol 2) with or without extended activin (Act). The protocols are depicted in Fig. S5 in the supplementary material. Expression levels are normalized to TBP. Bars represent mean±s.d. *P<0.05, **P<0.01 determined by ANOVA with Tukey's HSD test. (B) Intracellular flow-cytometric analysis of C-peptide and GCG at days 14, 20 and 22 of differentiation for protocol 1, 2 and 2+ACT, respectively. **P<0.01 determined by ANOVA with Tukey's HSD test. (C) Representative flow cytometric analysis of C-peptide and GCG at day 14 and 20 of differentiation using protocol 1 and protocol 2 showing the higher efficiency of protocol 2 in inducing endocrine cells as compared with protocol 1. Percentage of cells within each quadrant is indicated.
Fig. 6.
Fig. 6.
Pancreatic differentiation of different human pluripotent stem cells (hPSCs). (A) Quantitative PCR (QPCR) analysis for INS (black histogram) and ALB (red line) at d25 of differentiation in H1-derived populations generated in the presence of FGF10 alone (d7-10; ctrl) or FGF10 and 0.25 μM (dorso 0.25), 0.50 μM (dorso 0.50) or 0.75 μM (dorso 0.75) dorsomorphin. Line and bars represent mean±s.d. n=3. (B) Immunostaining for C-peptide (red) and PDX1 (green) at d27 in H1-derived cultures. (C,D) Flow-cytometric analysis of C-peptide at d25 of differentiation in untreated (Ctrl) and dorsomorphin-treated cultures (Dorso) of H1-derived cells. Percentage represents the mean percentage cells expressing C-peptide (s.d.=0.8 for D, n=3). (E) Flow cytometric analysis measuring GFP at d22 of differentiation in INS:GFP-HES3-derived populations. Cells were differentiated in the presence of 0.75 μM dorsomorphin (Dorso). Percentage represents the mean percentage of cells expressing GFP (s.d.=2.3%, n=4). (F) Presence of GFP+ clusters in the d22 population generated from the INS:GFP-HES3 cell line differentiated in the presence of 0.75 μM dorsomorphin (Dorso). (G-I) Immunostaining for C-peptide in day 22 INS:GFP HES3-derived populations. (J) QPCR analysis for INS in d25 populations generated from the 38-2 iPS cell line. Cells were differentiated in the absence (Ctrl) or presence of 0.75 μM dorsomorphin (Dorso). Bars represent mean±s.d. Asterisk indicates statistical significance determined by t-test. P=0.048, n=4. (K) Immunostaining for C-peptide in d27 populations generated from the 38-2 iPS cell line. (L,M) Flow-cytometric analysis of C-peptide at d25 of differentiation in 38-2-derived untreated (Ctrl) and dorsomorphin-treated populations (Dorso). Percentages represent the mean percentage of cells expressing C-peptide (s.d.=1.3% for L, n=4; s.d.=0.6% for M, n=3).
Fig. 7.
Fig. 7.
Isolation and characterization of endocrine populations. (A,B) Flow-cytometric analysis for GFP and the pan-Islet (HPi3; A) or the pan-Exocrine (HPx1; B) markers in INS:GFP-HES3-derived populations. (C-E) Quantitative PCR (QPCR) analysis for INS, SST, GCG, NEUROD1, PDX1, ARX, CELA1 and PTF1A in the pre-sort (PS), double negative (DN), INS:GFP+ and HPx1+ sorted populations. Values for adult pancreas (Ad pancreas) are shown for comparison. Bars represent mean±s.d., n=4. (F) Flow-cytometric analysis showing the presence of pan-Islet+ cells in a HES2-derived population at d22 of differentiation. (G) QPCR analysis for INS and GCG in the sorted populations: pre-sort (PS), pan-ISLET+ and pan-ISLET−. Bars represent mean±s.d., n=2.

References

    1. Ameri J., Stahlberg A., Pedersen J., Johansson J. K., Johannesson M. M., Artner I., Semb H. (2010). FGF2 specifies hESC-derived definitive endoderm into foregut/midgut cell lineages in a concentration-dependent manner. Stem Cells 28, 45-56 - PubMed
    1. Apelqvist A., Li H., Sommer L., Beatus P., Anderson D. J., Honjo T., Hrabe de Angelis M., Lendahl U., Edlund H. (1999). Notch signalling controls pancreatic cell differentiation. Nature 400, 877-881 - PubMed
    1. Bardeesy N., Cheng K. H., Berger J. H., Chu G. C., Pahler J., Olson P., Hezel A. F., Horner J., Lauwers G. Y., Hanahan D., et al. (2006). Smad4 is dispensable for normal pancreas development yet critical in progression and tumor biology of pancreas cancer. Genes Dev. 20, 3130-3146 - PMC - PubMed
    1. Borowiak M., Melton D. A. (2009). How to make beta cells? Curr. Opin. Cell Biol. 21, 727-732 - PMC - PubMed
    1. Cai J., Yu C., Liu Y., Chen S., Guo Y., Yong J., Lu W., Ding M., Deng H. (2009). Generation of homogeneous PDX1(+) pancreatic progenitors from human ES cell-derived endoderm cells. J. Mol. Cell Biol. 2, 50-60 - PubMed

Publication types