. 2011 Jan 26;11(1):10.1167/11.1.21 21.
doi: 10.1167/11.1.21.

The absolute threshold of cone vision

Affiliations

The absolute threshold of cone vision

Darren Koenig et al. J Vis. .

Abstract

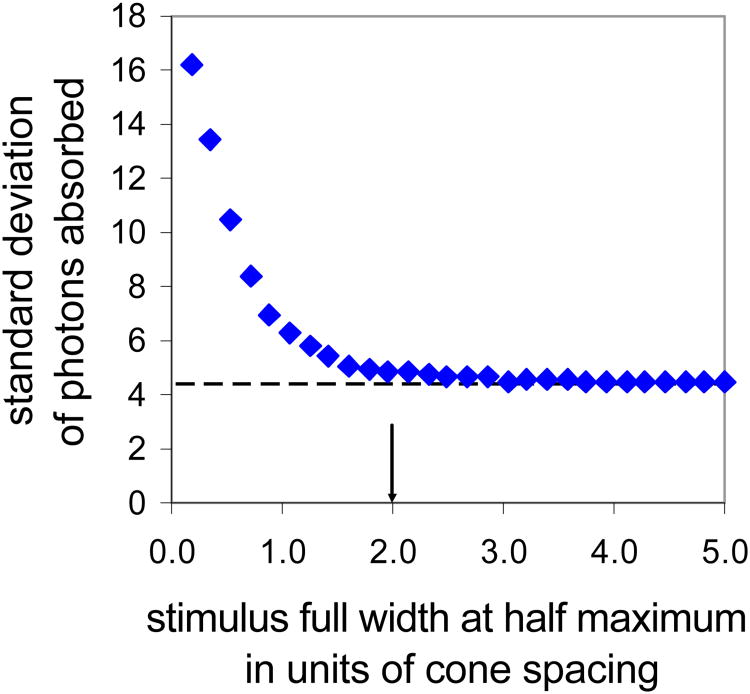
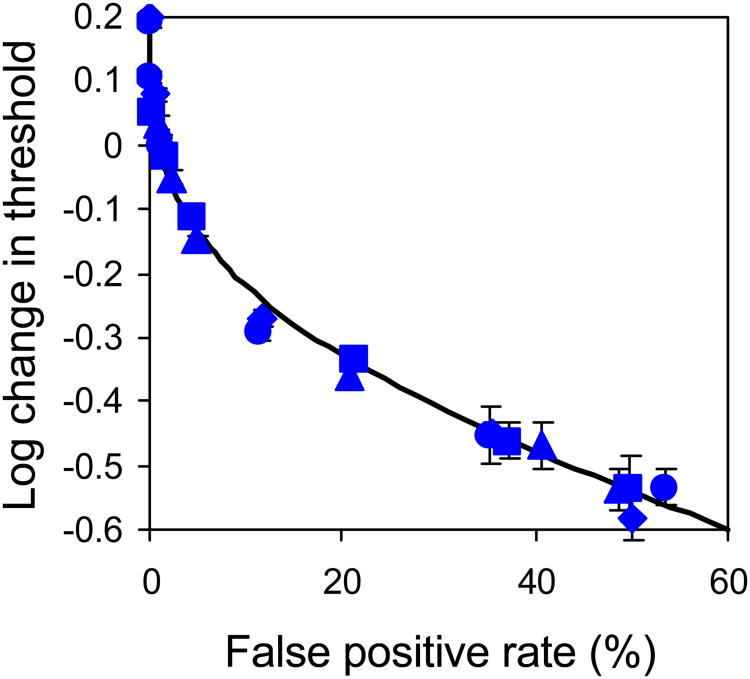
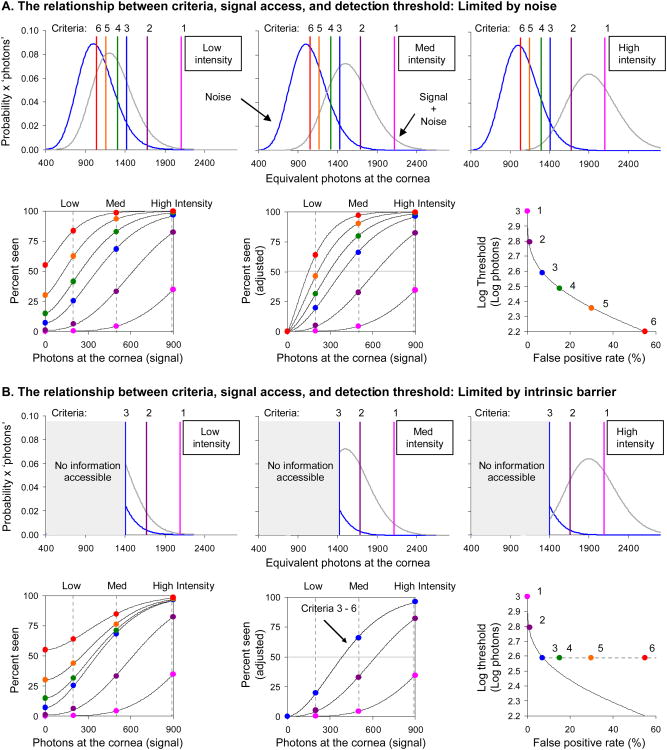
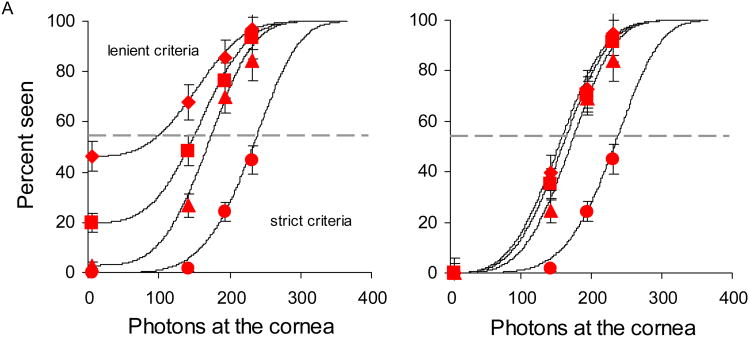
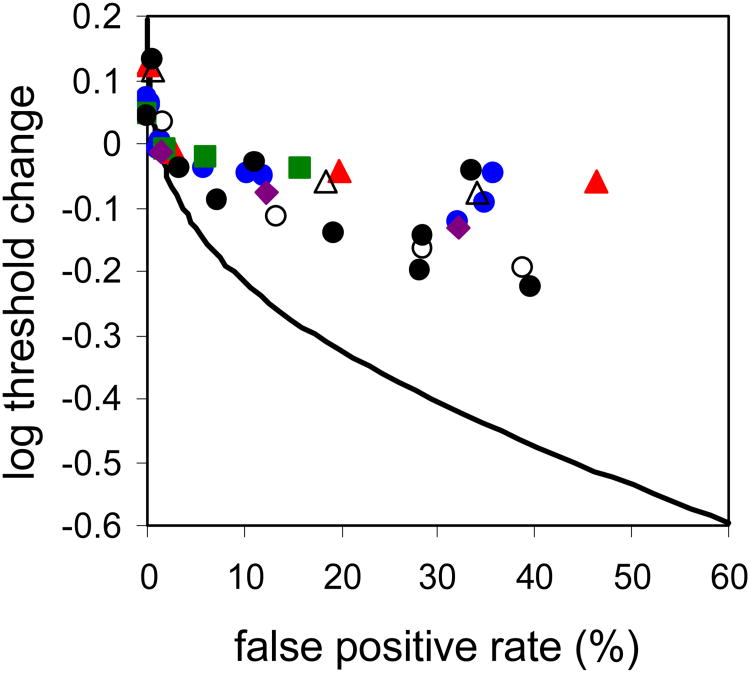
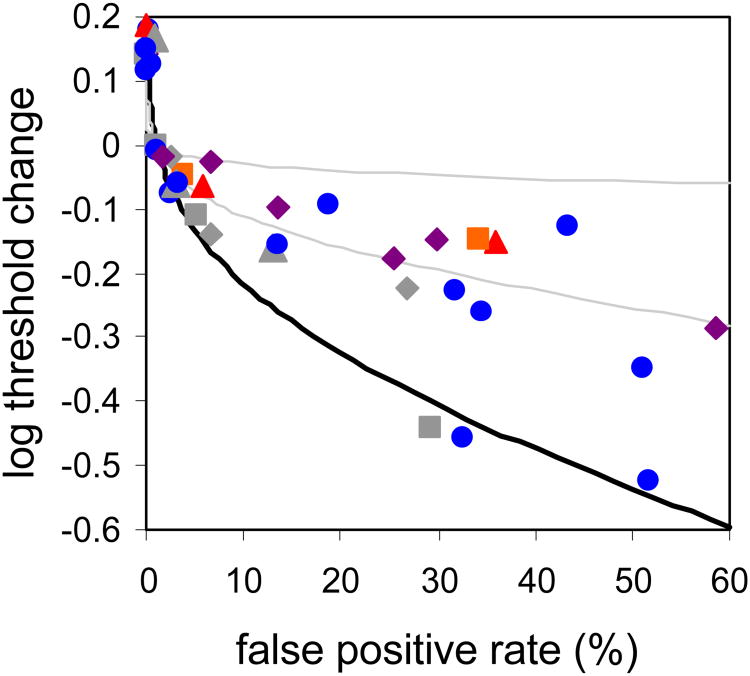
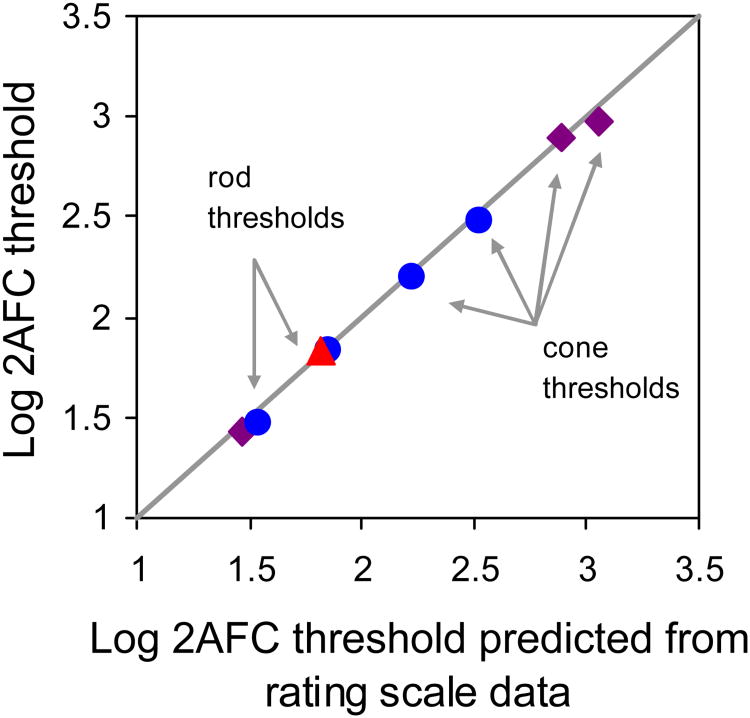
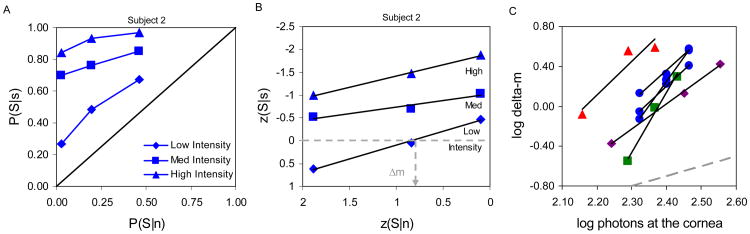
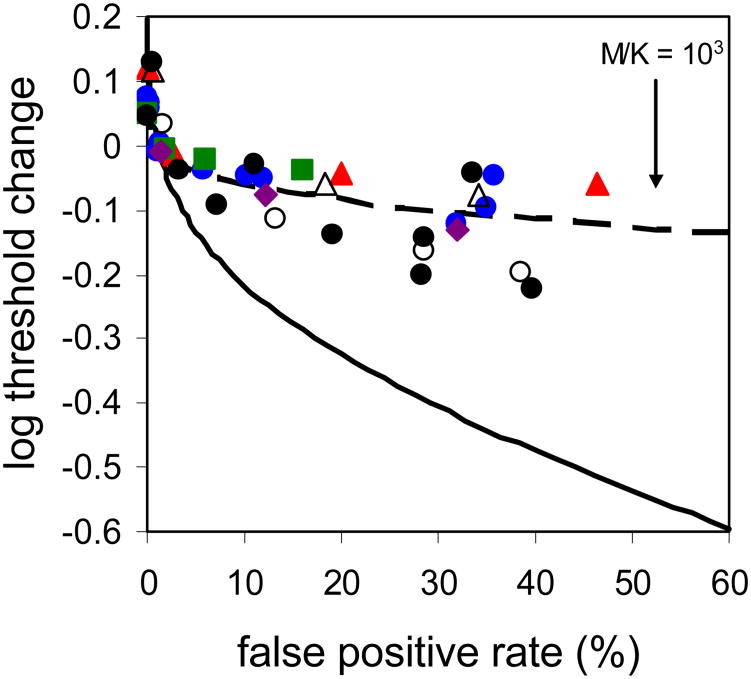
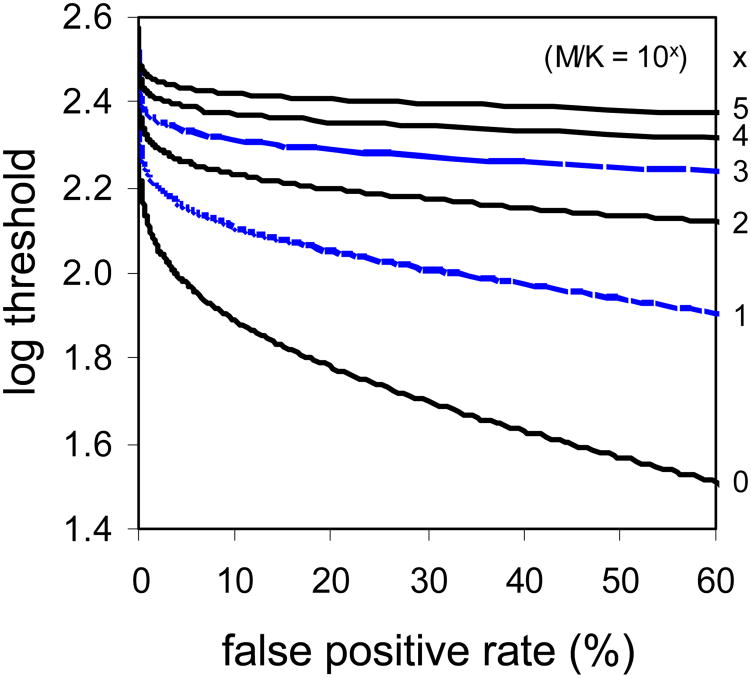
We report measurements of the absolute threshold of cone vision, which has been previously underestimated due to suboptimal conditions or overly strict subjective response criteria. We avoided these limitations by using optimized stimuli and experimental conditions while having subjects respond within a rating scale framework. Small (1' fwhm), brief (34 ms), monochromatic (550 nm) stimuli were foveally presented at multiple intensities in dark-adapted retina for 5 subjects. For comparison, 4 subjects underwent similar testing with rod-optimized stimuli. Cone absolute threshold, that is, the minimum light energy for which subjects were just able to detect a visual stimulus with any response criterion, was 203 ± 38 photons at the cornea, ~0.47 log unit lower than previously reported. Two-alternative forced-choice measurements in a subset of subjects yielded consistent results. Cone thresholds were less responsive to criterion changes than rod thresholds, suggesting a limit to the stimulus information recoverable from the cone mosaic in addition to the limit imposed by Poisson noise. Results were consistent with expectations for detection in the face of stimulus uncertainty. We discuss implications of these findings for modeling the first stages of human cone vision and interpreting psychophysical data acquired with adaptive optics at the spatial scale of the receptor mosaic.


Figures

Figure A1
Figure A1
Monte Carlo simulations indicate that the 1′ full width at half maximum cone detection stimulus is large enough to ignore the impact of spatial variation in the sensitivity of the cone mosaic on detection. Stimulus size is reported as the full width at half maximum in units of cone spacing, with the cone stimuli ranging from 2-3 units of cone spacing depending on subjects' foveal cone density. For these stimulus sizes actual variability in absorbed photons (blue diamonds) approaches that due to Poisson quantum variability (dashed line) alone. Error bars (± 1 SD) are the size of the symbols and are not included; each symbol represents the average of 5 simulated runs with 1500 trials per run.
Figure A2
Figure A2
Modeling of cascaded noise sources (squares), signal compression and quantization (diamonds), and subjective criterion uncertainty (triangles) reveals how they do not change the expected behavior for Poisson noise-limited detection processes (control (circles) and solid curve). Error bars are SD of log threshold for 5 simulated runs at 300 trials each for each scenario.
Figure 1
Figure 1
Signal detection theory (SDT; Green & Swets, 1966) predicts that in distinguishing a signal (grey distribution) from noise (blue distribution) observers can increase sensitivity and lower detection thresholds by using more lenient response criteria (represented by colored vertical lines and points, ranging from pink to red, and numbered 1 (strictest) – 6 (most lenient)). A) Low, medium, and high intensity stimuli (left, center and right; row 1, also indicated by the dashed vertical grey lines in row 2) are detected against irreducible noise. Detection thresholds are interpolated at 50% seen (at the intersection of the solid grey line and the frequency of seeing curves, row 2, center) after adjusting for the non-zero false positive rate as in Equation 1. Detection thresholds are still seen to decrease after this adjustment (row 2, right) indicating a net gain in performance with more lenient criteria. Row 2 right shows the expected Poisson noise-limited reduction in detection threshold (solid curve). B) An intrinsic barrier limits access to signal information (grey boxes, row 1). Subjects cannot reduce the detection criterion below this point. They can continue to increase the false positive rate by guessing, but the rate of seeing and of false positives increase in step and there is no further improvement in threshold (row 2). Row 2, right shows limited threshold reduction (plateau, dashed line) in the face of an intrinsic barrier to information access. All distributions shown are Poisson probability density functions.
Figure 2
Figure 2
A) Frequency of seeing curves for subject 2 for criteria C2 (diamonds), C3 (squares), C4 (triangles) and C5 (circles), ranging from lenient to strict. B) After adjusting for the non-zero false positive rate using Equation 1 the curves for the two most lenient criteria, C2 and C3, collapse onto each other, indicating no net benefit to detection. Solid curves are nonlinear least-squares Weibull fits to the frequency of seeing data.
Figure 3
Figure 3
Change in cone threshold as a function of false positive rate for subjects 1 (blue circles), 2 (red triangles), 3 (green squares) & 4 (purple diamonds).To better compare across subjects curves were shifted vertically with the aid of a detection model (described in detail in the Discussion section) so that the 1% false positive point, which loosely reflects a typical ‘yes-no’ threshold, coincides with a log threshold change of zero. Subjects' cone thresholds are significantly less responsive to reductions in the response criteria than expected for a linear Poisson noise-limited process (solid black line). Filled black circles are three additional trial runs for subject 1 where only relative and not absolute stimulus intensity information was available. Open symbols are the results for subjects 1 and 2 with an adapting background that are described later in the Discussion section.
Figure 4
Figure 4
Rod thresholds for our four subjects (Subjects 1 (blue circles), 2 (red triangles), 4 (purple diamonds) and 6 (orange squares)) and Sakitt's three subjects BS, LF and KD (grey squares, diamonds and triangles; Sakitt 1972). As in Figure 3, to better compare across subjects, curves were shifted vertically with the aid of a detection model (described in detail in the Discussion) so that the 1% false positive point, which loosely reflects a typical ‘yes-no’ threshold, coincides with a log threshold change of zero. Thresholds are significantly more responsive to reductions in response criteria for rods than for cones; range for cone data shown as light gray lines).
Figure 5
Figure 5
Measured 2AFC thresholds compared with predictions from rating scale data for subjects 1 (blue circles), 2 (red triangle) and 4 (purple diamonds). Thresholds were interpolated at 75% seen. Both rod and cone data lie along the line of unit slope, indicating high agreement between measured and predicted thresholds. This demonstrates that the complexity of the rating scale task did not adversely impact thresholds. Data shown for subjects 2 and 4 reflect relative and not absolute thresholds, since absolute stimulus intensity information was not available for these subjects. The prediction of 2AFC thresholds from rating data is described in detail in Sakitt (1972).
Figure 6
Figure 6
Receiver operating characteristic (ROC) analysis and the relationship between signal discriminability, Δm, and stimulus intensity for cone detection at absolute threshold. A) Typical ROC curves for subject 2. B) ROC curves for the same subject now on a double probability plot and with a sample estimation of discriminability from linear fits to the low intensity curve - Δm equals z(S|n) on the ROC curve where z(S|s) equals zero (dashed gray lines). On double probability plots slopes (σnsn) < 1 imply unequal variance in the noise and signal plus noise distributions; slopes for our subjects are uniformly < 1 (see also Table 3). C) Log Δm vs log stimulus energy for subjects 1 (blue circles), 2 (red triangles), 3 (green squares) and 4 (purple diamonds). Photons at the cornea for subject 4 are relative, all others are absolute. Datasets 4-6 for subject 1, where only relative thresholds were obtained, are not included but are included in Table 3 below. Unit slope, as expected for Poisson noise-limited detection, is shown for comparison (gray dashed line). All subjects demonstrate an acceleration of discriminability with signal strength in cone detection that is inconsistent with a linear Poisson noise-limited process.
Figure 7
Figure 7
Cone threshold behavior is well described by a model of detection incorporating uncertainty, described by Equations 5-7. An uncertainty (M/K) of 1000 best fits subjects' aggregate cone detection data: subject 1 (circles), 2 (green squares), 3 (red triangles) and 4 (purple diamonds). Subject 5′s data were not included due to false positive rates too low to allow confident fits. As in Figures 3 and 4, individual subjects' data were shifted so that a false positive rate of 1% (loosely indicating a typical ‘yes-no’ threshold) corresponds to a log threshold change of zero.
Figure 8
Figure 8
Uncertainty, M/K, elevates thresholds and decreases the responsiveness of threshold to changes in response criteria (false positive rate). Shown are predictions of how uncertainty impacts thresholds, and the responsiveness of threshold to changes in criteria, for different values of M/K. These curves were calculated from Equations 5-7. Log(M/K) of 3 and 1 best accounted for subjects' aggregate cone and rod data.

References

    1. Arathorn DW, Yang Q, Vogel CR, Zhang Y, Tiruveedhula P, Roorda A. Retinally stabilized cone-targeted stimulus delivery. Optics Express. 2007;15(21):13731–13744. - PubMed
    1. Barlow HB. Retinal noise and absolute threshold. Journal of the Optical Society of America. 1956;46(8):634–639. - PubMed
    1. Barlow HB. Increment thresholds at low intensities considered as signal/noise discriminations. Journal of Physiology. 1957;136:469–488. - PMC - PubMed
    1. Barlow HB. Visual Problems of Colour. II. London: Her Majesty's Stationery Office; 1958. Intrinsic noise of cones; pp. 617–630.
    1. Barlow HB. Retinal and central factors in human vision limited by noise. In: Barlow HB, Fatt P, editors. Vertebrate Photoreception. San Fransisco, California: Academic Press; 1977.

Publication types