. 2011 Feb;60(2):427-35.
doi: 10.2337/db10-0409.

The adipocyte-expressed forkhead transcription factor Foxc2 regulates metabolism through altered mitochondrial function

Affiliations

The adipocyte-expressed forkhead transcription factor Foxc2 regulates metabolism through altered mitochondrial function

Martin E Lidell et al. Diabetes. 2011 Feb.

Abstract

Objective: Previous findings demonstrate that enhanced expression of the forkhead transcription factor Foxc2 in adipose tissue leads to a lean and insulin-sensitive phenotype. These findings prompted us to further investigate the role of Foxc2 in the regulation of genes of fundamental importance for metabolism and mitochondrial function.

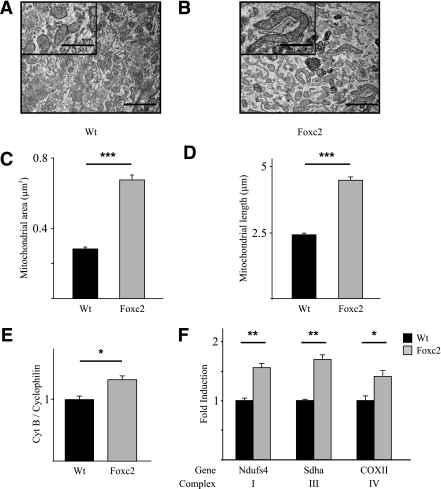
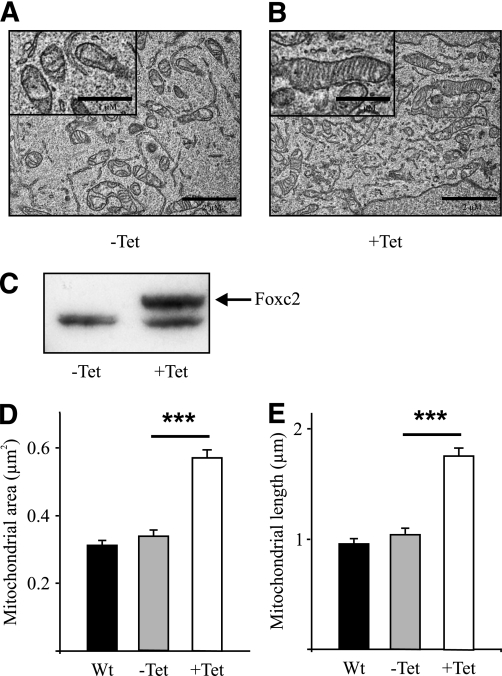
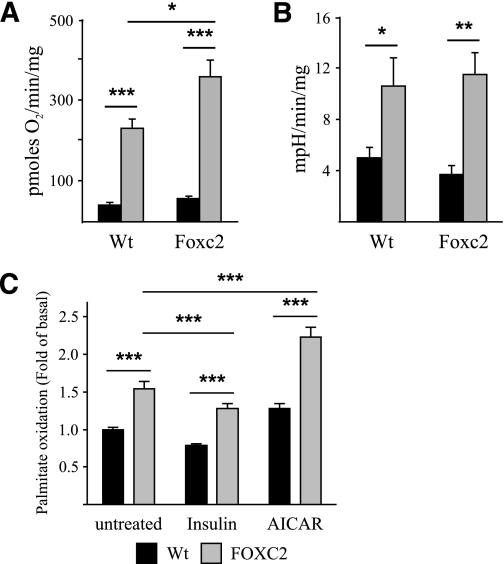
Research design and methods: The effects of Foxc2 on expression of genes involved in mitochondriogenesis and mitochondrial function were assessed by quantitative real-time PCR. The potential of a direct transcriptional regulation of regulated genes was tested in promoter assays, and mitochondrial morphology was investigated by electron microscopy. Mitochondrial function was tested by measuring oxygen consumption and extracellular acidification rates as well as palmitate oxidation.

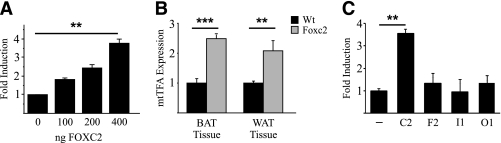
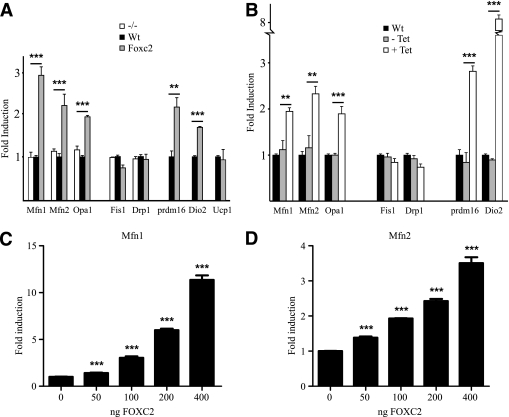
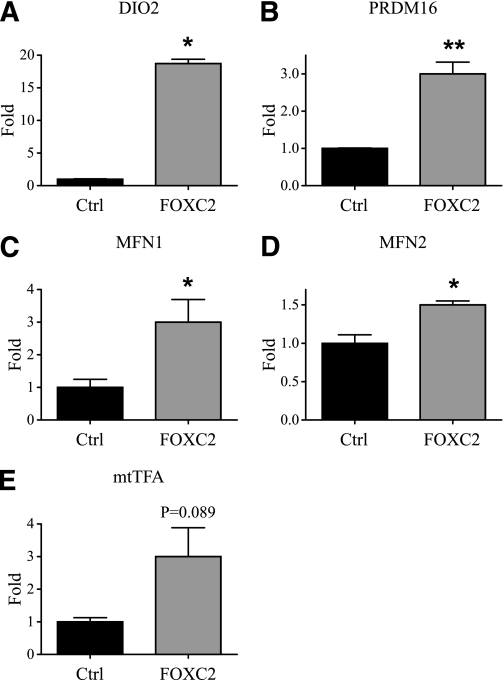
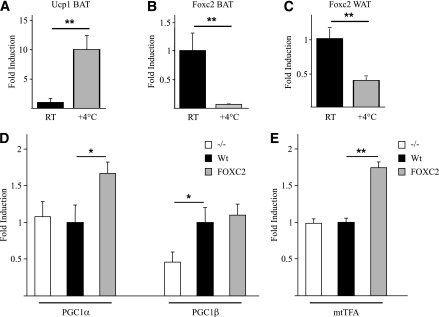
Results: Enhanced expression of FOXC2 in adipocytes or in cells with no endogenous Foxc2 expression induces mitochondriogenesis and an elongated mitochondrial morphology. Together with increased aerobic metabolic capacity, increased palmitate oxidation, and upregulation of genes encoding respiratory complexes and of brown fat-related genes, Foxc2 also specifically induces mitochondrial fusion genes in adipocytes. Among tested forkhead genes, Foxc2 is unique in its ability to trans-activate the nuclear-encoded mitochondrial transcription factor A (mtTFA/Tfam) gene--a master regulator of mitochondrial biogenesis. In human adipose tissue the expression levels of mtTFA/Tfam and of fusion genes also correlate with that of Foxc2.

Conclusions: We previously showed that a high-calorie diet and insulin induce Foxc2 in adipocytes; the current findings identify a previously unknown role for Foxc2 as an important metabo-regulator of mitochondrial morphology and metabolism.


Figures

FIG. 1.
FIG. 1.
Foxc2 regulates mtTFA. A: 3T3-L1 cells were transiently transfected with a luciferase reporter plasmid harboring an mtTFA promoter and an increasing amount (0–400 ng) of FOXC2 expression vector. **P = 0.01. B: Real-time PCR analysis of mtTFA mRNA expression in white adipose tissue (WAT) and brown adipose tissue (BAT) derived from Foxc2 overexpressing mice (gray bars) and WT littermates (black bars). **P = 0.01; ***P = 0.001. C: Cotransfections in 3T3-L1 cells using mtTFA-promoter-luciferase reporter-construct and expression vectors for a selection of forkhead genes (Foxc2, Foxf2, Foxi1, and FoxO1). **P = 0.01; n = 3.
FIG. 2.
FIG. 2.
MEFs with elevated Foxc2 expression have increased levels of mitochondrial DNA, elongated mitochondria, and induced expression of genes in the electron transport chain. Mitochondrial area and length measured in 150 view fields on differentiated MEFs derived from WT and Foxc2 transgenic mice (AD) are shown. ***P = 0.001. Representative electron micrographs of differentiated MEFs (A and B) are shown. Real-time PCR analysis of Cytochrome B and Cyklophilin A genomic DNA (E) and genes in electron transport chain complexes I (Ndufs4), III (Sdha), and IV (COXII) in differentiated MEFs (F) from Foxc2 transgenic mice (gray bars) and cells from WT littermates (black bars) is shown. *P = 0.05; **P = 0.01; ***P = 0.001; n = 3. Scale bar represents 2 μm (1 μm in magnified view field).
FIG. 3.
FIG. 3.
Ectopic expression of Foxc2 in HEK293 cells induces mitochondrial biogenesis and fusion. Representative electron micrographs of control HEK293 cells (−Tet) (A) and of HEK293 cells with an induced FOXC2 expression (+Tet) (B) are shown. Scale bar represents 2 μm (1 μm in magnified view field). Western blot analysis (C) of doxycycline-induced Foxc2 expression in HEK293 cells (+Tet) and of control cells (−Tet) is shown. The upper band represents Foxc2, and the lower band is an unspecific band that serves as loading control. Mitochondrial area (D) and length (E) measured in 150 view fields on WT HEK293 cells (black bars) and on HEK293 cells presenting a doxycycline-dependent overexpression of FOXC2 before (−Tet; gray bars) and after (+Tet; white bars) doxycycline treatment are shown. ***P = 0.001.
FIG. 4.
FIG. 4.
Foxc2 induces expression of genes involved in mitochondrial fusion. Real-time PCR analysis of Mfn1, Mfn2, and Opa1 (genes involved in mitochondrial fusion) and of Fis1 and Drp1 (genes involved in mitochondrial fission) and Prdm16, Dio2, and Ucp1 (genes expressed in brown fat) is shown. A: Expression profile of MEF-derived adipocytes from mice deficient in Foxc2 expression (white bars), WT (black bars), and mice overexpressing Foxc2 (gray bars). **P = 0.01; ***P = 0.001. B: Gene expression in WT HEK293 cells (black bars), uninduced Tet-Foxc2 HEK293 (gray bars), and induced Tet-Foxc2 HEK293 cells (white bars). **P = 0.01; ***P = 0.001; n = 3. Transient transfections of 3T3-L1 cells with a Foxc2 expression vector together with Mfn1 (C) or Mfn2 (D) promoter reporter constructs show that Foxc2 induce the promoters in a dose-dependent way. ***P = 0.001; n = 3.
FIG. 5.
FIG. 5.
Effects of an increased FOXC2 expression in human adipocytes. Quantitative real-time PCR analyses of the expression levels of DIO2 (A), PRDM16 (B), MFN1 (C), MFN2 (D), and mtTFA (E) in human adipocytes infected either by a control adenovirus expressing ZS-green (Ctrl) or by an adenovirus expressing FOXC2 (FOXC2) are shown. *P = 0.05; **P = 0.01; n = 3.
FIG. 6.
FIG. 6.
Cells overexpressing Foxc2 have increased aerobic capacity and enhanced levels of palmitate oxidation. A: Oxygen consumption rates in MEF-derived adipocytes from WT and Foxc2 overexpressing mice. Basal rates were determined in the absence of uncoupler (black bars), whereas maximal rates were determined after the addition of uncoupler (1 μmol/L FCCP; gray bars; n = 4 multiwell plates/genotype). *P = 0.05; ***P = 0.001. B: Extracellular acidification rates, a surrogate measure of glycolytic activity (see research design and methods), in MEF-derived adipocytes from WT and Foxc2 overexpressing mice. Basal rates were determined in the absence of uncoupler (black bars), whereas maximal rates were determined after the addition of uncoupler (1 μmol/L FCCP; gray bars; n = 4 multiwell plates/genotype). *P = 0.05; **P = 0.01. C: Palmitate oxidation was measured in MEF-derived adipocytes from WT (black bars) and FOXC2 overexpressing (gray bars) mice under basal conditions and in the presence of 100 nmol/L insulin (inhibitor of fatty acid oxidation) or 1 mmol/L AICAR (activator of AMP-activated protein kinase [AMPK]). Values are calculated as fold differences compared with palmitate oxidation under basal conditions in MEF-derived adipocytes from WT mice (n = six multiwell plates/genotype). **P = 0.01; ***P = 0.001. As expected, insulin decreased, whereas AICAR stimulated fatty acid oxidation in a similar manner both in the adipocytes derived from WT and FOXC2 overexpressing mice. Oxidation of palmitate was higher in adipocytes with increased expression of FOXC2 compared with the WT adipocytes under basal conditions and after treatment with insulin and AMPK activator AICAR.
FIG. 7.
FIG. 7.
Real-time PCR analysis. Measurements of Ucp1 (A) and Foxc2 (B and C) mRNA in WAT and BAT of WT mice, kept at room temperature (RT, black bars) or exposed to cold (+4°C for 16 h; gray bars) are shown. **P = 0.01. MEF-derived adipocytes overexpressing Foxc2 have induced expression of PGC1α and mtTFA. Real-time PCR analysis of PGC1α and PGC1β (D) and mtTFA (E) mRNA levels in MEF-derived adipocytes from mice deficient in Foxc2 expression (white bars), WT (black bars), and mice overexpressing Foxc2 (gray bars) is shown. *P = 0.05; **P = 0.01; n = 3.

References

    1. Civitarese AE, Ravussin E. Mitochondrial energetics and insulin resistance. Endocrinology 2008;149:950–954 - PMC - PubMed
    1. Rodgers JT, Lerin C, Haas W, Gygi SP, Spiegelman BM, Puigserver P. Nutrient control of glucose homeostasis through a complex of PGC-1alpha and SIRT1. Nature 2005;434:113–118 - PubMed
    1. Mootha VK, Lindgren CM, Eriksson KF, et al. PGC-1alpha-responsive genes involved in oxidative phosphorylation are coordinately downregulated in human diabetes. Nat Genet 2003;34:267–273 - PubMed
    1. Björntorp P, Scherstén T, Fagerberg SE. Respiration and phosphorylation of mitochondria isolated from the skeletal muscle of diabetic and normal subjects. Diabetologia 1967;3:346–352 - PubMed
    1. Koves TR, Ussher JR, Noland RC, et al. Mitochondrial overload and incomplete fatty acid oxidation contribute to skeletal muscle insulin resistance. Cell Metab 2008;7:45–56 - PubMed

Publication types

MeSH terms