Randomized Controlled Trial
. 2011 Mar 24;117(12):3294-301.
doi: 10.1182/blood-2010-08-301796. Epub 2011 Jan 26.

Results from a randomized trial of salvage chemotherapy followed by lestaurtinib for patients with FLT3 mutant AML in first relapse

Affiliations
Randomized Controlled Trial

Results from a randomized trial of salvage chemotherapy followed by lestaurtinib for patients with FLT3 mutant AML in first relapse

Mark Levis et al. Blood. .

Abstract

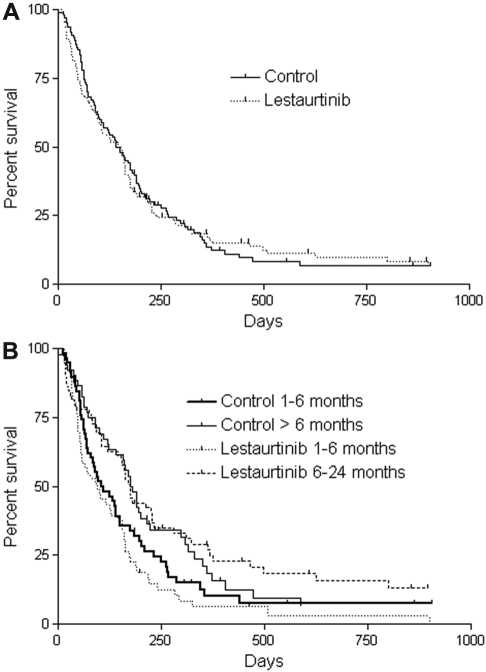
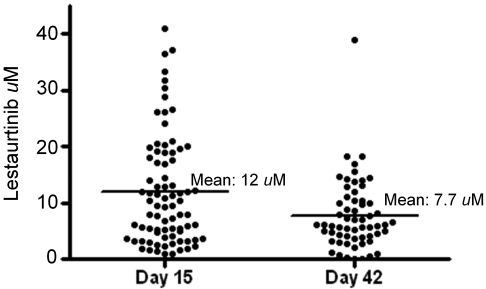
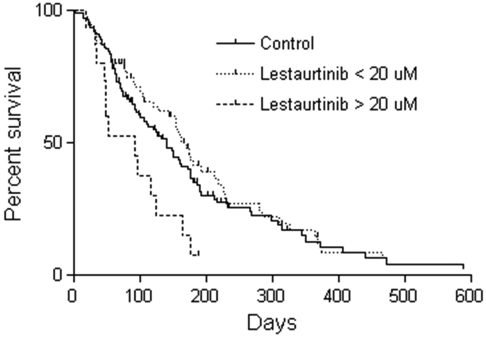
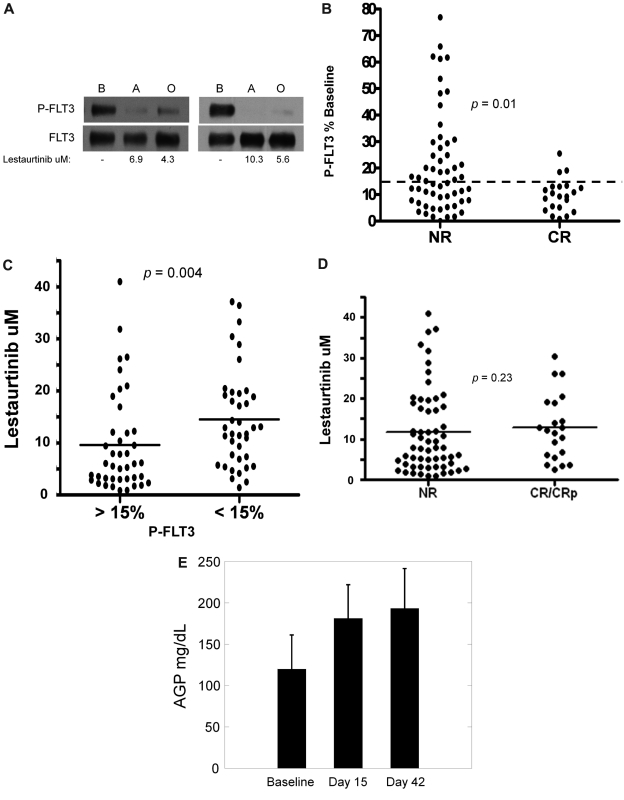
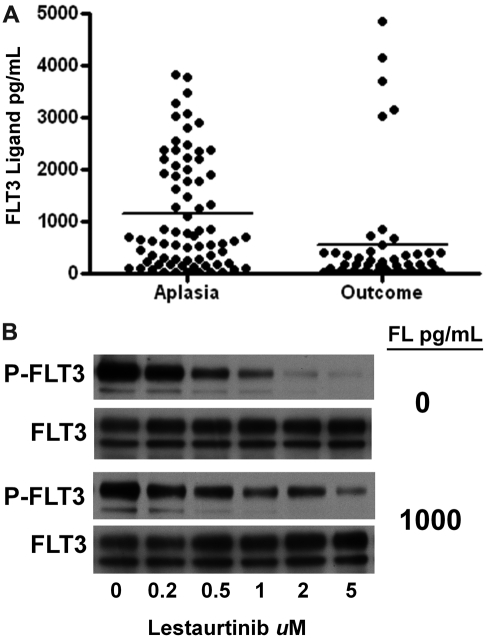
In a randomized trial of therapy for FMS-like tyrosine kinase-3 (FLT3) mutant acute myeloid leukemia in first relapse, 224 patients received chemotherapy alone or followed by 80 mg of the FLT3 inhibitor lestaurtinib twice daily. Endpoints included complete remission or complete remission with incomplete platelet recovery (CR/CRp), overall survival, safety, and tolerability. Correlative studies included pharmacokinetics and analysis of in vivo FLT3 inhibition. There were 29 patients with CR/CRp in the lestaurtinib arm and 23 in the control arm (26% vs 21%; P = .35), and no difference in overall survival between the 2 arms. There was evidence of toxicity in the lestaurtinib-treated patients, particularly those with plasma levels in excess of 20 μM. In the lestaurtinib arm, FLT3 inhibition was highly correlated with remission rate, but target inhibition on day 15 was achieved in only 58% of patients receiving lestaurtinib. Given that such a small proportion of patients on this trial achieved sustained FLT3 inhibition in vivo, any conclusions regarding the efficacy of combining FLT3 inhibition with chemotherapy are limited. Overall, lestaurtinib treatment after chemotherapy did not increase response rates or prolong survival of patients with FLT3 mutant acute myeloid leukemia in first relapse. This study is registered at www.clinicaltrials.gov as #NCT00079482.


Figures

Figure 1
Figure 1
Overall survival. (A) Kaplan-Meier estimates of OS from the time of randomization for patients who were randomized to the lestaurtinib arm compared with the control arm. Patients who received an allogeneic transplant were censored at the date of the allogeneic transplantation. (B) OS by duration of first remission. Kaplan-Meier estimates of OS from the time of randomization for patients whose first remission lasted from 1 to 6 months, and for patients whose first remission lasted more than 6 months. Patients who received an allogeneic transplant were censored at the date of the allogeneic transplantation.
Figure 2
Figure 2
Steady-state plasma lestaurtinib levels. Individual plasma lestaurtinib levels determined 12 hours after the most recent dose on or within 2 days of day 15 (aplasia assessment) and day 42 (outcome assessment). The horizontal lines indicate the mean levels for each time point.
Figure 3
Figure 3
OS according to plasma level of lestaurtinib. At the aplasia assessment, 15 of 79 patients from whom lestaurtinib levels were measured had levels in excess of 20μM. Shown are Kaplan-Meier estimates of OS from the time of randomization for these 15 patients (dashed line) compared with the other 64 patients on the lestaurtinib arm (dotted line) and the control arm patients (solid line). The median survival for those patients with lestaurtinib levels more than 20μM is significantly different from both the other lestaurtinib patients (P = .002) and the control patients (P = .01).
Figure 4
Figure 4
Pharmacokinetic and pharmacodynamic correlatives. (A) PIA assay for FLT3 in trial patients. Shown are results from 2 separate patients on the lestaurtinib arm. The upper blots were probed with antiphosphotyrosine. The blots were stripped and reprobed for total FLT3 (lower blots). Shown below the blots are the measured levels of lestaurtinib from plasma obtained at the same time points as that used in the assay. B indicates baseline; A, aplasia; and O, outcome. (B) FLT3 inhibition grouped according to response. Results from individual FLT3 PIA assays from the aplasia assessment are plotted, grouped according to whether or not the patient attained a complete remission. The dashed line indicates the targeted level of 15% of baseline FLT3 activity. (C) Lestaurtinib plasma level grouped according to FLT3 inhibition. Results from individual measurements of plasma lestaurtinib at the aplasia assessment are plotted, grouped according to whether or not the plasma inhibitory activity for FLT3 from the same time point was above (inadequate inhibition) or below (adequate inhibition) the 15% target level. (D) Lestaurtinib plasma level grouped according to response. Results from individual measurements of plasma lestaurtinib at the aplasia assessment are plotted, grouped according to whether or not the patient achieved a complete remission. NR indicates no response. (E) AGP levels. AGP concentrations (milligrams per deciliter of plasma) were determined using an immunodiffusion assay from plasma samples obtained at baseline, the aplasia assessment (day 15), and the outcome assessment (day 42).
Figure 5
Figure 5
FLT3 ligand levels. (A) FL levels were determined with an enzyme-linked immunosorbent assay using plasma samples obtained at the aplasia and outcome assessments. The individual results are plotted, with solid lines indicating the mean level for each group. (B) The effect of FL on the FLT3 inhibitory activity of lestaurtinib. TF/ITD cells, expressing ITD-mutated FLT3, were incubated in plasma containing increasing concentrations of lestaurtinib in the presence or absence of 1000 pg/mL FL. After immunoprecipitation for FLT3 and electrophoresis, the blots were probed with antiphosphotyrosine (top blot), and then stripped and reprobed for total FLT3 (bottom blot).

Comment in

References

    1. Nakao M, Yokota S, Iwai T, et al. Internal tandem duplication of the flt3 gene found in acute myeloid leukemia. Leukemia. 1996;10(12):1911–1918. - PubMed
    1. Levis M, Small D. FLT3: ITDoes matter in leukemia. Leukemia. 2003;17(9):1738–1752. - PubMed
    1. Kiyoi H, Naoe T, Nakano Y, et al. Prognostic implication of FLT3 and N-RAS gene mutations in acute myeloid leukemia. Blood. 1999;93(9):3074–3080. - PubMed
    1. Kottaridis PD, Gale RE, Frew ME, et al. The presence of a FLT3 internal tandem duplication in patients with acute myeloid leukemia (AML) adds important prognostic information to cytogenetic risk group and response to the first cycle of chemotherapy: analysis of 854 patients from the United Kingdom Medical Research Council AML 10 and 12 trials. Blood. 2001;98(6):1752–1759. - PubMed
    1. Schnittger S, Schoch C, Dugas M, et al. Analysis of FLT3 length mutations in 1003 patients with acute myeloid leukemia: correlation to cytogenetics, FAB subtype, and prognosis in the AMLCG study and usefulness as a marker for the detection of minimal residual disease. Blood. 2002;100(1):59–66. - PubMed

Publication types

MeSH terms

Associated data