

Integrated analysis of the conformation of a protein-linked spin label by crystallography, EPR and NMR spectroscopy
- PMID: 21271275
- PMCID: PMC3042103
- DOI: 10.1007/s10858-011-9471-y
Integrated analysis of the conformation of a protein-linked spin label by crystallography, EPR and NMR spectroscopy
Abstract
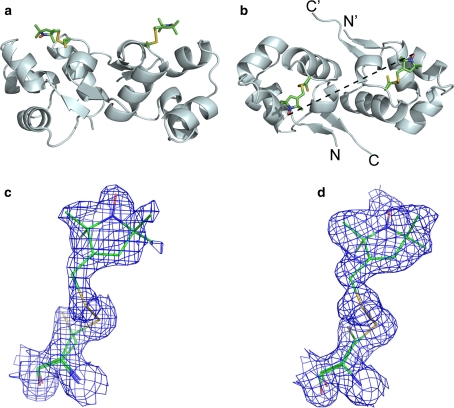
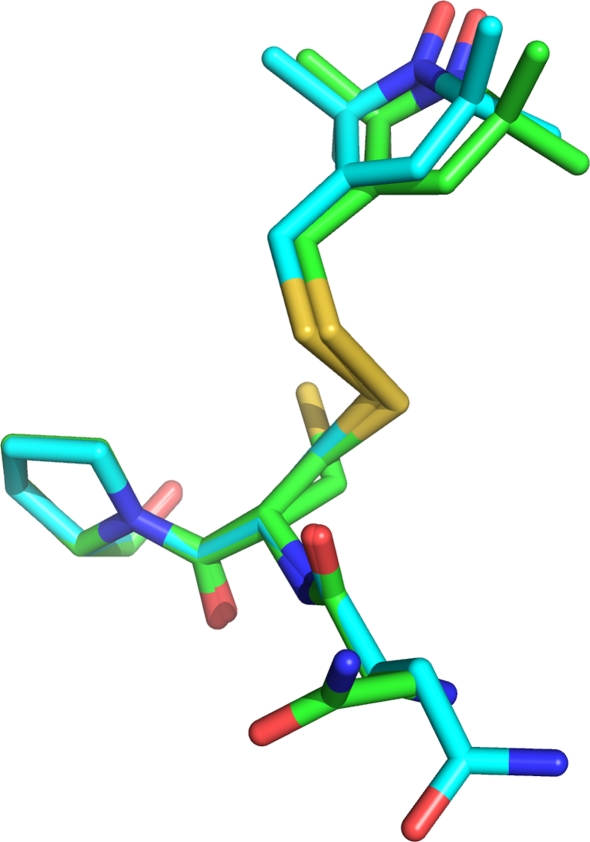
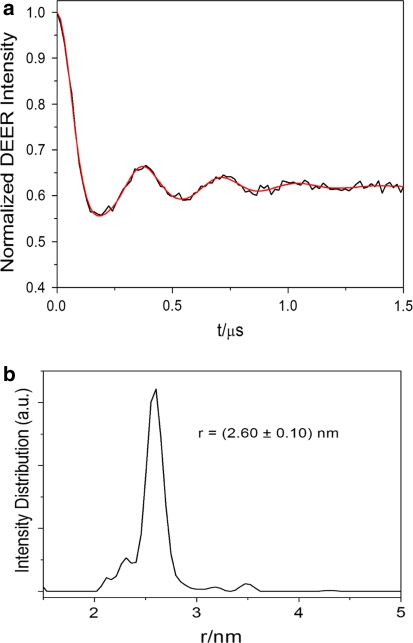
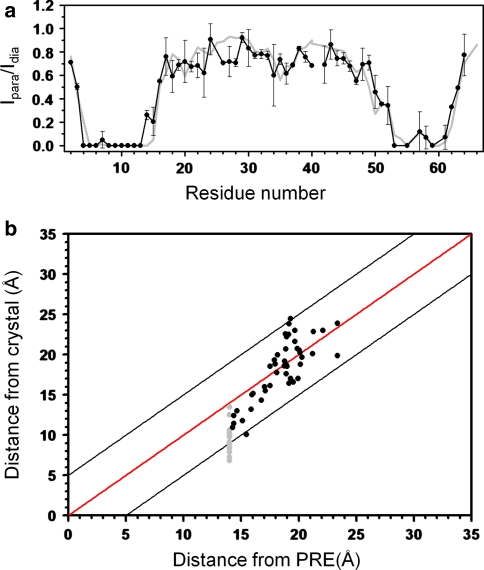
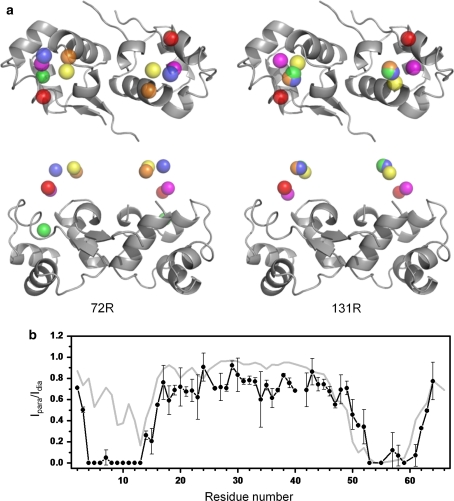
Long-range structural information derived from paramagnetic relaxation enhancement observed in the presence of a paramagnetic nitroxide radical is highly useful for structural characterization of globular, modular and intrinsically disordered proteins, as well as protein-protein and protein-DNA complexes. Here we characterized the conformation of a spin-label attached to the homodimeric protein CylR2 using a combination of X-ray crystallography, electron paramagnetic resonance (EPR) and NMR spectroscopy. Close agreement was found between the conformation of the spin label observed in the crystal structure with interspin distances measured by EPR and signal broadening in NMR spectra, suggesting that the conformation seen in the crystal structure is also preferred in solution. In contrast, conformations of the spin label observed in crystal structures of T4 lysozyme are not in agreement with the paramagnetic relaxation enhancement observed for spin-labeled CylR2 in solution. Our data demonstrate that accurate positioning of the paramagnetic center is essential for high-resolution structure determination.
Figures
Similar articles
-
Determination of interspin distances between spin labels attached to insulin: comparison of electron paramagnetic resonance data with the X-ray structure.Biophys J. 1997 Dec;73(6):3287-98. doi: 10.1016/S0006-3495(97)78353-X. Biophys J. 1997. PMID: 9414239 Free PMC article.
-
Molecular origin of electron paramagnetic resonance line shapes on β-barrel membrane proteins: the local solvation environment modulates spin-label configuration.Biochemistry. 2011 Oct 18;50(41):8792-803. doi: 10.1021/bi200971x. Epub 2011 Sep 22. Biochemistry. 2011. PMID: 21894979 Free PMC article.
-
EPR Techniques to Probe Insertion and Conformation of Spin-Labeled Proteins in Lipid Bilayers.Methods Mol Biol. 2019;2003:493-528. doi: 10.1007/978-1-4939-9512-7_21. Methods Mol Biol. 2019. PMID: 31218631
-
Nitroxide spin labels and EPR spectroscopy: A powerful association for protein dynamics studies.Biochim Biophys Acta Proteins Proteom. 2021 Jul;1869(7):140653. doi: 10.1016/j.bbapap.2021.140653. Epub 2021 Mar 20. Biochim Biophys Acta Proteins Proteom. 2021. PMID: 33757896 Review.
-
New limits of sensitivity of site-directed spin labeling electron paramagnetic resonance for membrane proteins.Biochim Biophys Acta Biomembr. 2018 Apr;1860(4):841-853. doi: 10.1016/j.bbamem.2017.12.009. Epub 2017 Dec 14. Biochim Biophys Acta Biomembr. 2018. PMID: 29247610 Review. No abstract available.
Cited by
-
DNA binding induces a cis-to-trans switch in Cre recombinase to enable intasome assembly.Proc Natl Acad Sci U S A. 2020 Oct 6;117(40):24849-24858. doi: 10.1073/pnas.2011448117. Epub 2020 Sep 23. Proc Natl Acad Sci U S A. 2020. PMID: 32968014 Free PMC article.
-
Technological advances in site-directed spin labeling of proteins.Curr Opin Struct Biol. 2013 Oct;23(5):725-33. doi: 10.1016/j.sbi.2013.06.008. Epub 2013 Jul 11. Curr Opin Struct Biol. 2013. PMID: 23850140 Free PMC article. Review.
-
When detergent meets bilayer: birth and coming of age of lipid bicelles.Prog Nucl Magn Reson Spectrosc. 2013 Feb;69:1-22. doi: 10.1016/j.pnmrs.2013.01.001. Epub 2013 Jan 23. Prog Nucl Magn Reson Spectrosc. 2013. PMID: 23465641 Free PMC article. Review. No abstract available.
-
The magic of bicelles lights up membrane protein structure.Chem Rev. 2012 Nov 14;112(11):6054-74. doi: 10.1021/cr300061w. Epub 2012 Aug 24. Chem Rev. 2012. PMID: 22920148 Free PMC article. Review. No abstract available.
-
The near-symmetry of protein oligomers: NMR-derived structures.Sci Rep. 2020 May 20;10(1):8367. doi: 10.1038/s41598-020-65097-8. Sci Rep. 2020. PMID: 32433550 Free PMC article.
References
-
- Bermejo GA, Strub MP, Ho C, Tjandra N. Determination of the solution-bound conformation of an amino acid binding protein by NMR paramagnetic relaxation enhancement: use of a single flexible paramagnetic probe with improved estimation of its sampling space. J Am Chem Soc. 2009;131:9532–9537. doi: 10.1021/ja902436g. - DOI - PMC - PubMed
Publication types
MeSH terms
Substances
LinkOut - more resources
Full Text Sources
