. 2011 May;54(5):1087-97.
doi: 10.1007/s00125-010-2039-7. Epub 2011 Jan 27.

Defects in beta cell Ca²+ signalling, glucose metabolism and insulin secretion in a murine model of K(ATP) channel-induced neonatal diabetes mellitus

Affiliations

Defects in beta cell Ca²+ signalling, glucose metabolism and insulin secretion in a murine model of K(ATP) channel-induced neonatal diabetes mellitus

R K P Benninger et al. Diabetologia. 2011 May.

Abstract

Aims/hypothesis: Mutations that render ATP-sensitive potassium (K(ATP)) channels insensitive to ATP inhibition cause neonatal diabetes mellitus. In mice, these mutations cause insulin secretion to be lost initially and, as the disease progresses, beta cell mass and insulin content also disappear. We investigated whether defects in calcium signalling alone are sufficient to explain short-term and long-term islet dysfunction.

Methods: We examined the metabolic, electrical and insulin secretion response in islets from mice that become diabetic after induction of ATP-insensitive Kir6.2 expression. To separate direct effects of K(ATP) overactivity on beta cell function from indirect effects of prolonged hyperglycaemia, normal glycaemia was maintained by protective exogenous islet transplantation.

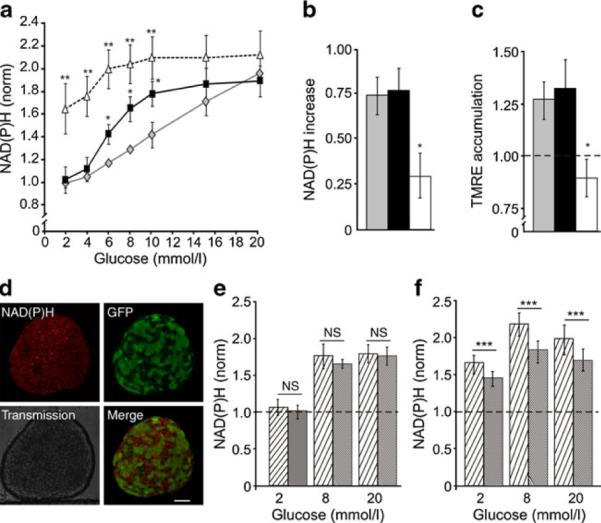
Results: In endogenous islets from protected animals, glucose-dependent elevations of intracellular free-calcium activity ([Ca(2+)](i)) were severely blunted. Insulin content of these islets was normal, and sulfonylureas and KCl stimulated increased [Ca(2+)](i). In the absence of transplant protection, [Ca(2+)](i) responses were similar, but glucose metabolism and redox state were dramatically altered; sulfonylurea- and KCl-stimulated insulin secretion was also lost, because of systemic effects induced by long-term hyperglycaemia and/or hypoinsulinaemia. In both cases, [Ca(2+)](i) dynamics were synchronous across the islet. After reduction of gap-junction coupling, glucose-dependent [Ca(2+)](i) and insulin secretion was partially restored, indicating that excitability of weakly expressing cells is suppressed by cells expressing mutants, via gap-junctions.

Conclusions/interpretation: The primary defect in K(ATP)-induced neonatal diabetes mellitus is failure of glucose metabolism to elevate [Ca(2+)](i), which suppresses insulin secretion and mildly alters islet glucose metabolism. Loss of insulin content and mitochondrial dysfunction are secondary to the long-term hyperglycaemia and/or hypoinsulinaemia that result from the absence of glucose-dependent insulin secretion.


Figures

Fig. 1
Fig. 1
Glucose-stimulated [Ca2+]i activity in islets from DTG protected and DTG diabetic mice. a Mean [Ca2+]i concentration in islets measured using Fura2 fluorescence. Islets were removed from control (grey bars), DTG protected (black bars) and DTG diabetic (white bars) mice, stimulated with 2 and 20 mmol/l glucose. ***p<0.001 by the unpaired Student's t test. A significant increase in Ca2+ was observed at 20 mmol/l compared with 2 mmol/l glucose for DTG protected (p<0.01) and DTG diabetic (p<0.05). b Temporal progression of the Fluo-4/FuraRed ratio, averaged over single endogenous islets that were harvested from four different control mice (left) and from four different DTG protected mice (right), following 2 mmol/l glucose, (c) 10 mmol/l glucose and (d) 20 mmol/l glucose stimulation. Time courses are offset with respect to each other for clarity, scale bar (y-axis) indicates twofold change in Fluo4/FuraRed. e Time-averaged Fluo4:FuraRed ratio in control islets (grey diamonds) and DTG protected islets (black squares), as a function of glucose concentration, glucose (20 mmol/l) plus sulfonylurea treatment (100 μmol/l tolbutamide [Tol]) or glucose (20 mmol/l) plus KCl treatment (30 mmol/l). Data averaged over n=4 mice, n=3–6 islets per mouse. f Time-averaged Fluo4/FuraRed ratio as above (e) for control islets (grey diamonds) and DTG diabetic islets (white triangles). Data averaged over n=4 mice, n=3–4 islets per mouse. All Fluo4/FuraRed ratios were normalised (norm) to the ratio measured at 2 mmol/l glucose. *p<0.05 and NS p>0.05 for each experimental condition comparing control islets and DTG protected or DTG diabetic islets (unpaired Student's t test)
Fig. 2
Fig. 2
Glucose metabolism in islets from DTG protected and DTG diabetic mice. a Glucose dose–response of NAD(P)H in islets from control (grey diamonds), DTG protected (black squares) and DTG diabetic (white triangles) mice, measured from normalised (norm) NAD(P)H fluorescence (n=4 mice, n=4–6 islets per mouse). b Change in NAD(P)H from 2 to 20 mmol/l glucose in islets of control (grey bars), DTG protected (black bars) and DTG diabetic (white bars) mice (n=4 mice, n=4–6 islets per mouse). c Mitochondrial TMRE accumulation in islets at 20 mmol/l glucose, normalised to TMRE fluorescence at 2 mmol/l, as represented above (b); n=3 mice, n=4–7 islets per mouse; *p<0.05 and **p<0.01 for each experimental condition (a–c) comparing control islets and DTG protected or DTG diabetic islets (unpaired Student's t test). d Pseudo-colour image of NAD(P)H fluorescence (red), GFP fluorescence (green) and transmission (grey) in an islet from a DTG protected mouse. Separate channels and merged GFP/NAD(P)H images are shown. Scale bar, 50 μm. e Mean NAD(P)H fluorescence signal at glucose as indicated in islets from DTG protected mice. NAD(P)H fluorescence was measured in cells with high GFP fluorescence (GFP-positive; hatched bars) and low GFP fluorescence (GFP-negative; shaded bars); n=7 mice, n=4–7 islets per mouse. All data normalised (norm) to the mean NAD(P)H level in control islets at 2 mmol/l glucose (dotted grey line). f Mean NAD(P)H fluorescence signal as above (e) in islets from DTG diabetic mice; n=5 mice, n=4 islets per mouse). Mean and SEM (e, f) were calculated from absolute NAD(P)H values averaged over each mouse studied. For difference in means ± 95% CI (e, f), see ESM Fig. 4a, b, respectively. ***p<0.001 and NS p>0.05 (paired Student's t test)
Fig. 3
Fig. 3
Glucose metabolism in islets from DTG protected mice upon modulation of [Ca2+]i. a Normalised (norm) NAD(P)H and normalised Fluo4 time course in control islets upon stimulation with glucose (G) and diazoxide treatment as indicated. NAD(P)H was measured first, then a Fluo4 fluorescence time course was measured before and after elevation of glucose from 2 to 10 mmol/l in the presence of 250 μmol/l diazoxide. NAD(P)H and Fluo4 fluorescence time course were subsequently measured following wash-off of diazoxide. Time between measurements of NAD(P)H was 20 min. Values are mean ± SEM. NAD(P)H signal and a representative time course of Fluo4 fluorescence are shown for each glucose and diazoxide treatment. Horizontal scale bar 60 s. b As above (a), but with DTG protected islets. c Mean per cent change in NAD(P)H at 10 mmol/l glucose compared with NAD(P)H at the same glucose concentration in the presence of 250 μmol/l diazoxide in islets of control (grey bar) and DTG protected (black bar) mice. *p<0.05 (paired Student's t test)
Fig. 4
Fig. 4
[Ca2+]i in individual cells of DTG protected islets. a Time course of normalised (norm.) FuraRed fluorescence from a single DTG protected islet in cells with GFP expression and at glucose concentrations as indicated. Scale bar represents twofold change in FuraRed. b Per cent of islet cells showing changes in [Ca2+]i at 2 or 20 mmol/l glucose (G), as shown above (a), for islets from control mice (grey bars) and DTG protected mice (black bars). **p<0.01 (unpaired Student's t test). c Per cent of DTG protected islet cells showing [Ca2+]i bursting in cells with high GFP (hatched bars) and low GFP (shaded bars). Data (b, c) are average of n=4 mice, n=3–5 islets per mouse. NS p>0.05. d Time course of normalised Fluo4 fluorescence, illustrated by two sets of traces, in several cells from two representative DTG diabetic islets stimulated with 20 mmol/l glucose. Some synchronised [Ca2+]i bursting can be seen by simultaneous changes in Fluo4 signal. Scale bar represents twofold change in Fluo-4. e Quantification of the synchronisation of [Ca2+]i bursting in control islets (grey bars), DTG protected islets (black bars) and DTG diabetic islets (white bars), all at 10 mmol/l glucose stimulation. **p<0.01 (unpaired Student's t test)
Fig. 5
Fig. 5
Ca2+ activity and insulin secretion are increased in DTG protected islets upon reduction of gap-junction coupling. a Percentage of cells showing [Ca2+]i bursting at 20 mmol/l glucose in 14 DTG protected islets before and after application of the gap-junction inhibitor αGA (50 μmol/l). An increase was seen in all 14 islets studied (isolated from four mice). b Insulin secretion from islets of control mice (grey bars) and DTG protected mice (black bars), stimulated with 1 or 23 mmol/l glucose and αGA (0, 10 or 50 μmol/l), as indicated. *p<0.05 and NS p>0.05 (unpaired Student's t test). c Per cent of isolated cells showing [Ca2+]i bursting at glucose or glucose plus KCl (30 mmol/l) as indicated from islets of control mice (grey bars) and DTG protected mice (black bars). *p<0.05 for each experimental condition vs 2 mmol/l glucose within each group. d Percentage of isolated cells showing [Ca2+]i bursting in cells with high GFP (hatched bars) and low GFP (shaded bars). Data (c, d) averaged over n=3 mice; n=2–3 cell preparations per mouse. ***p<0.001 (unpaired Student's t test). e Insulin secretion, normalised to insulin content, in dispersed cells from islets of control (grey bars) or DTG protected (black bars) mice, stimulated with glucose as indicated or with glucose as indicated plus KCl (30 mmol/l). Data averaged over n=4 mice, three cell preparations per mouse. *p<0.05 and **p<0.01 for each experimental condition vs 1 mmol/l glucose within each group

Similar articles

Cited by

References

    1. Nichols CG. K-ATP channels as molecular sensors of cellular metabolism. Nature. 2006;440:470–476. - PubMed
    1. Hattersley AT, Ashcroft FM. Activating mutations in Kir6.2 and neonatal diabetes—new clinical syndromes, new scientific insights, and new therapy. Diabetes. 2005;54:2503–2513. - PubMed
    1. Gloyn AL, Pearson ER, Antcliff JF, et al. Activating mutations in the gene encoding the ATP-sensitive potassium-channel subunit Kir6.2 and permanent neonatal diabetes. N Engl J Med. 2004;350:1838–1849. - PubMed
    1. Koster JC, Marshall BA, Ensor N, Corbett JA, Nichols CG. Targeted overactivity of beta cell K-ATP channels induces profound neonatal diabetes. Cell. 2000;100:645–654. - PubMed
    1. Remedi MS, Kurata HT, Scott A, et al. Secondary consequences of beta cell inexcitability: identification and prevention in a murine model of K-ATP-induced neonatal diabetes mellitus. Cell Metab. 2009;9:140–151. - PMC - PubMed

Publication types