

Simulation of the lo-ld phase boundary in DSPC/DOPC/cholesterol ternary mixtures using pairwise interactions
- PMID: 21271714
- PMCID: PMC3057374
- DOI: 10.1021/jp110243v
Simulation of the lo-ld phase boundary in DSPC/DOPC/cholesterol ternary mixtures using pairwise interactions
Abstract
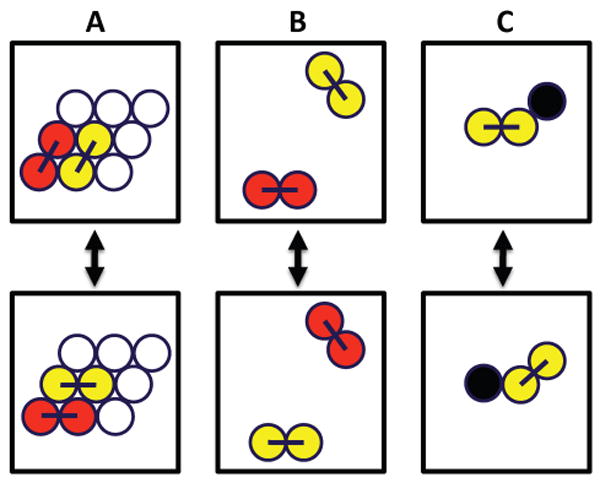
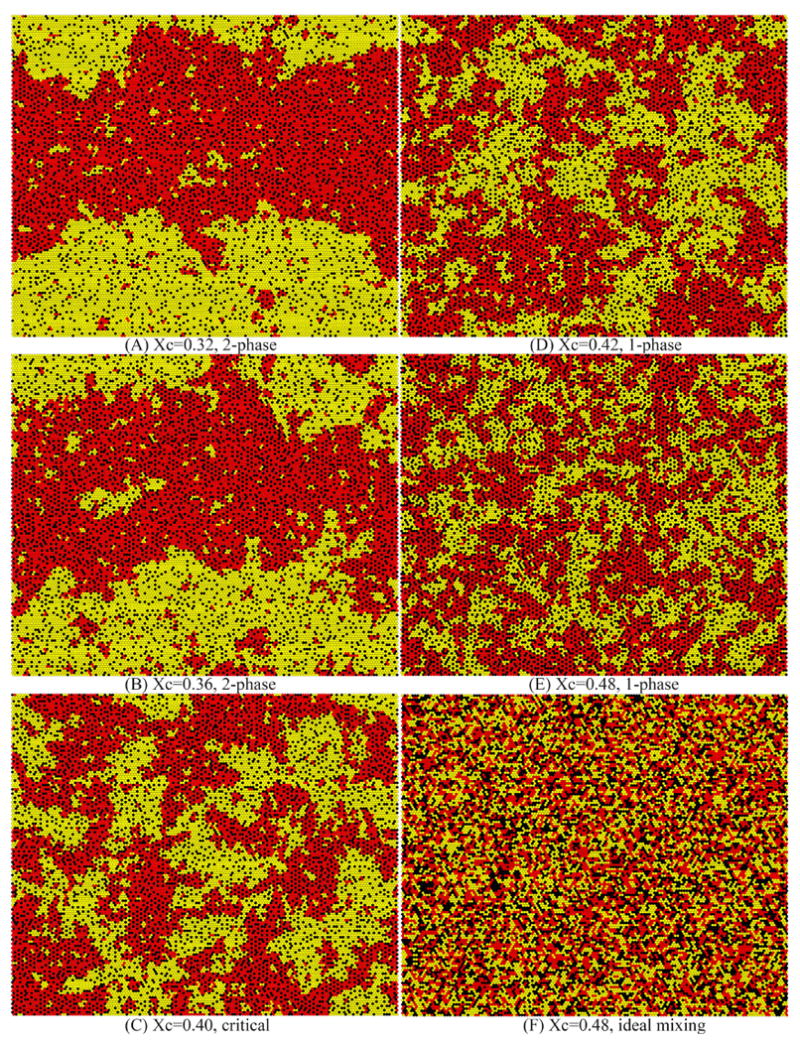
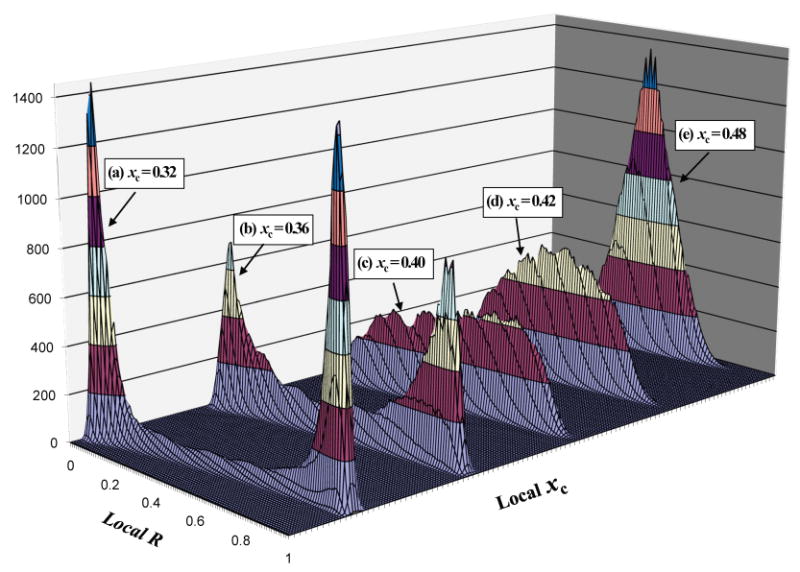
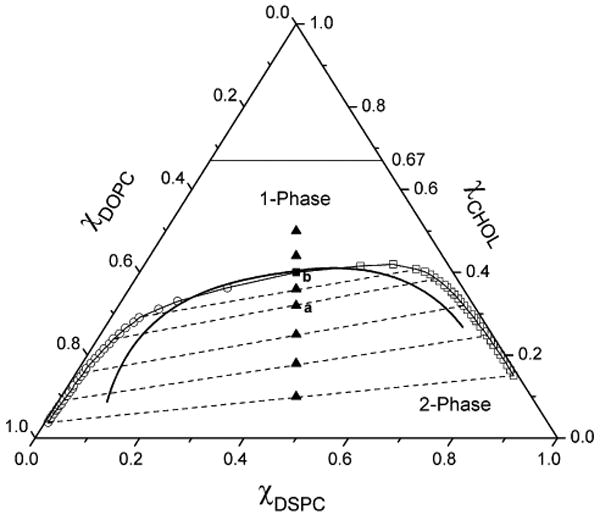
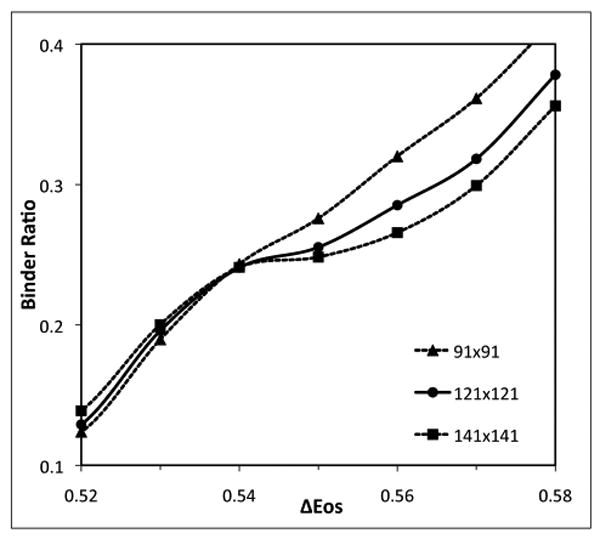
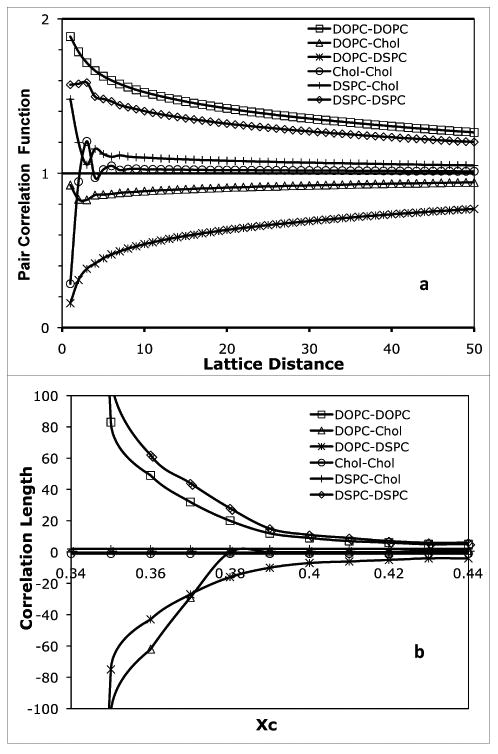
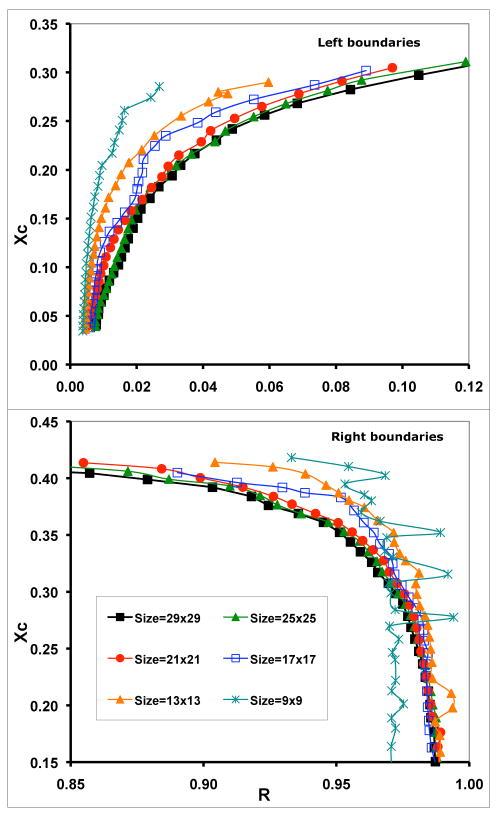
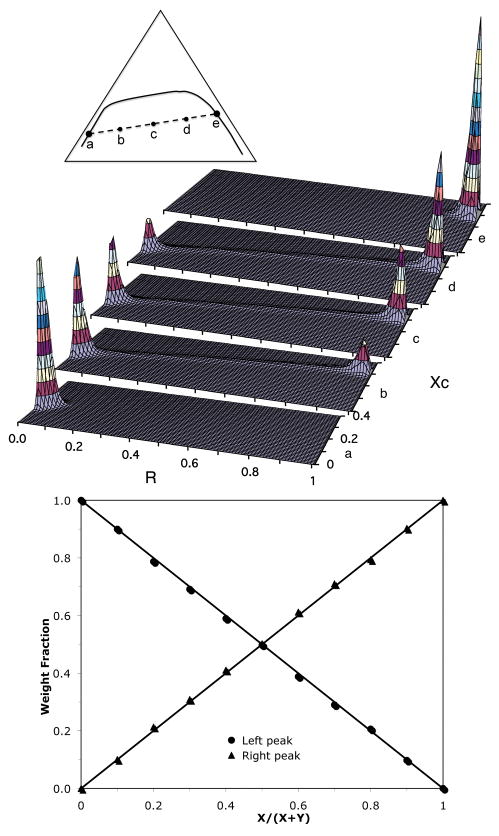
Recently, a number of ternary phase diagrams of lipid mixtures have been constructed using various experimental techniques with a common goal of understanding the nature of lipid domains. An accurate experimental phase diagram can provide rich thermodynamic information and can also be used to extract molecular interactions using computer simulation. In this study, the liquid-ordered and liquid-disordered (l(o)-l(d)) phase boundary of DSPC/DOPC/Cholesterol ternary mixtures is simulated in a lattice model using pairwise interactions. The block composition distribution (BCD) technique was used to locate accurately the compositions of coexisting phases and thermodynamics tie-lines in the two-phase region, and the Binder ratio method was used to determine the phase boundary in the critical region. In simulations performed along a thermodynamic tie-line, the BCD method correctly samples the compositions as well as the relative amounts of coexisting phases, which is in excellent agreement with the lever rule. A "best-fit" phase boundary was obtained that has a top boundary closely resembling the experimental boundary. However, the width of the simulated two-phase region is significantly wider than the experimental one. The results show that pairwise interactions alone are not sufficient to describe the complexity of molecular interactions in the ternary lipid mixtures; more complex forms of interactions, possibly multibody interaction or domain interfacial energy, should be included in the simulation.
Figures
Similar articles
-
Gramicidin Peptides Alter Global Lipid Compositions and Bilayer Thicknesses of Coexisting Liquid-Ordered and Liquid-Disordered Membrane Domains.Langmuir. 2017 Apr 4;33(13):3324-3332. doi: 10.1021/acs.langmuir.6b03688. Epub 2017 Mar 20. Langmuir. 2017. PMID: 28267920
-
Atomistic simulation of cholesterol effects on miscibility of saturated and unsaturated phospholipids: implications for liquid-ordered/liquid-disordered phase coexistence.J Am Chem Soc. 2011 Mar 16;133(10):3625-34. doi: 10.1021/ja110425s. Epub 2011 Feb 22. J Am Chem Soc. 2011. PMID: 21341653
-
Phase diagram of ternary cholesterol/palmitoylsphingomyelin/palmitoyloleoyl-phosphatidylcholine mixtures: spin-label EPR study of lipid-raft formation.Biophys J. 2012 Apr 18;102(8):1856-65. doi: 10.1016/j.bpj.2012.03.043. Biophys J. 2012. PMID: 22768941 Free PMC article.
-
Permeability of membranes in the liquid ordered and liquid disordered phases.Nat Commun. 2019 Dec 9;10(1):5616. doi: 10.1038/s41467-019-13432-7. Nat Commun. 2019. PMID: 31819053 Free PMC article.
-
An Unexpected Driving Force for Lipid Order Appears in Asymmetric Lipid Bilayers.J Am Chem Soc. 2023 Oct 11;145(40):21717-21722. doi: 10.1021/jacs.3c05081. Epub 2023 Sep 8. J Am Chem Soc. 2023. PMID: 37683131 Review.
Cited by
-
Functional lipid pairs as building blocks of phase-separated membranes.Proc Natl Acad Sci U S A. 2020 Mar 3;117(9):4749-4757. doi: 10.1073/pnas.1919264117. Epub 2020 Feb 18. Proc Natl Acad Sci U S A. 2020. PMID: 32071249 Free PMC article.
-
Monte Carlo simulation of protein-induced lipid demixing in a membrane with interactions derived from experiment.Biophys J. 2011 Oct 19;101(8):1930-7. doi: 10.1016/j.bpj.2011.09.015. Biophys J. 2011. PMID: 22004747 Free PMC article.
-
The Phase Behavior and Organization of Sphingomyelin/Cholesterol Membranes: A Deuterium NMR Study.Biophys J. 2018 Mar 27;114(6):1344-1356. doi: 10.1016/j.bpj.2018.01.024. Biophys J. 2018. PMID: 29590592 Free PMC article.
-
Barcoding Biological Reactions with DNA-Functionalized Vesicles.Angew Chem Int Ed Engl. 2019 Dec 16;58(51):18683-18690. doi: 10.1002/anie.201911544. Epub 2019 Oct 31. Angew Chem Int Ed Engl. 2019. PMID: 31596992 Free PMC article. Review.
-
Low-flux scanning electron diffraction reveals substructures inside the ordered membrane domain.Sci Rep. 2020 Dec 21;10(1):22188. doi: 10.1038/s41598-020-79083-7. Sci Rep. 2020. PMID: 33349660 Free PMC article.
References
Publication types
MeSH terms
Substances
Grants and funding
LinkOut - more resources
Full Text Sources
Medical
Research Materials
Miscellaneous
