

Acetate supplementation attenuates lipopolysaccharide-induced neuroinflammation
- PMID: 21272004
- PMCID: PMC3070819
- DOI: 10.1111/j.1471-4159.2011.07198.x
Acetate supplementation attenuates lipopolysaccharide-induced neuroinflammation
Abstract
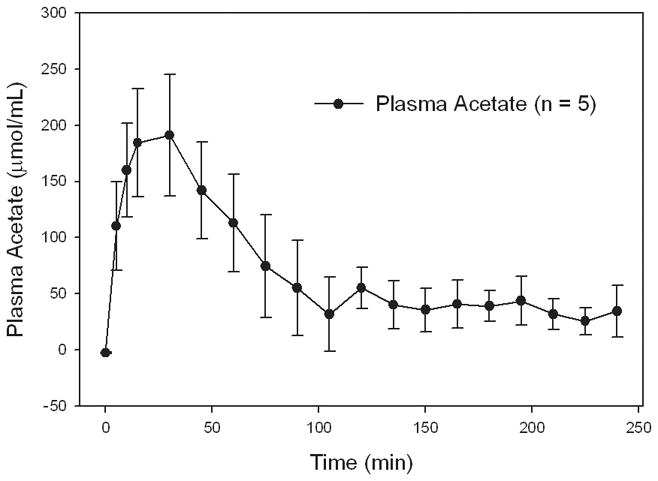
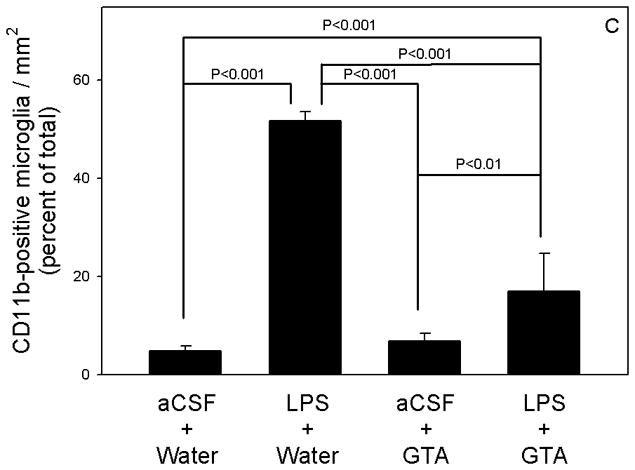
Glyceryl triacetate (GTA), a compound effective at increasing circulating and tissue levels of acetate was used to treat rats subjected to a continual 28 day intra-ventricular infusion of bacterial lipopolysaccharide (LPS). This model produces a neuroinflammatory injury characterized by global neuroglial activation and a decrease in choline acetyltransferase immunoreactivity in the basal forebrain. During the LPS infusion, rats were given a daily treatment of either water or GTA at a dose of 6 g/kg by oral gavage. In parallel experiments, free-CoA and acetyl-CoA levels were measured in microwave fixed brains and flash frozen heart, liver, kidney and muscle following a single oral dose of GTA. We found that a single oral dose of GTA significantly increased plasma acetate levels by 15 min and remained elevated for up to 4 h. At 30 min the acetyl-CoA levels in microwave-fixed brain and flash frozen heart and liver were increased at least 2.2-fold. The concentrations of brain acetyl-CoA was significantly increased between 30 and 45 min following treatment and remained elevated for up to 4 h. The concentration of free-CoA in brain was significantly decreased compared to controls at 240 min. Immunohistochemical and morphological analysis demonstrated that a daily treatment with GTA significantly reduced the percentage of reactive glial fibrillary acidic protein-positive astrocytes and activated CD11b-positive microglia by 40-50% in rats subjected to LPS-induced neuroinflammation. Further, in rats subjected to neuroinflammation, GTA significantly increased the number of choline acetyltransferase (ChAT)-positive cells by 40% in the basal forebrain compared to untreated controls. These data suggest that acetate supplementation increases intermediary short chain acetyl-CoA metabolism and that treatment is potentially anti-inflammatory and neuroprotective with regards to attenuating neuroglial activation and increasing ChAT immunoreactivity in this model.
© 2011 The Authors. Journal of Neurochemistry © 2011 International Society for Neurochemistry.
Figures


Similar articles
-
Acetate supplementation modulates brain adenosine metabolizing enzymes and adenosine A₂A receptor levels in rats subjected to neuroinflammation.J Neuroinflammation. 2014 Jun 4;11:99. doi: 10.1186/1742-2094-11-99. J Neuroinflammation. 2014. PMID: 24898794 Free PMC article.
-
Acetate supplementation reduces microglia activation and brain interleukin-1β levels in a rat model of Lyme neuroborreliosis.J Neuroinflammation. 2012 Nov 7;9:249. doi: 10.1186/1742-2094-9-249. J Neuroinflammation. 2012. PMID: 23134838 Free PMC article.
-
Acetate supplementation modulates brain histone acetylation and decreases interleukin-1β expression in a rat model of neuroinflammation.J Neuroinflammation. 2012 Mar 13;9:51. doi: 10.1186/1742-2094-9-51. J Neuroinflammation. 2012. PMID: 22413888 Free PMC article.
-
Dose-dependent changes in neuroinflammatory and arachidonic acid cascade markers with synaptic marker loss in rat lipopolysaccharide infusion model of neuroinflammation.BMC Neurosci. 2012 May 23;13:50. doi: 10.1186/1471-2202-13-50. BMC Neurosci. 2012. Retraction in: BMC Neurosci. 2017 May 9;18(1):40. doi: 10.1186/s12868-017-0360-5. PMID: 22621398 Free PMC article. Retracted.
-
Loss of locus coeruleus noradrenergic neurons alters the inflammatory response to LPS in substantia nigra but does not affect nigral cell loss.J Neural Transm (Vienna). 2014 Dec;121(12):1493-505. doi: 10.1007/s00702-014-1223-1. Epub 2014 Apr 30. J Neural Transm (Vienna). 2014. PMID: 24781752
Cited by
-
Glyceryl triacetate promotes blood-brain barrier recovery after ischemic stroke through lipogenesis-mediated IL-33 in mice.J Neuroinflammation. 2023 Nov 15;20(1):264. doi: 10.1186/s12974-023-02942-3. J Neuroinflammation. 2023. PMID: 37968698 Free PMC article.
-
Short chain fatty acids: key regulators of the local and systemic immune response in inflammatory diseases and infections.Open Biol. 2023 Mar;13(3):230014. doi: 10.1098/rsob.230014. Epub 2023 Mar 29. Open Biol. 2023. PMID: 36977462 Free PMC article. Review.
-
Acetate reduces microglia inflammatory signaling in vitro.J Neurochem. 2012 Nov;123(4):555-67. doi: 10.1111/j.1471-4159.2012.07955.x. Epub 2012 Sep 28. J Neurochem. 2012. PMID: 22924711 Free PMC article.
-
Abnormal intestinal milieu in posttraumatic stress disorder is not impacted by treatment that improves symptoms.Am J Physiol Gastrointest Liver Physiol. 2022 Aug 1;323(2):G61-G70. doi: 10.1152/ajpgi.00066.2022. Epub 2022 May 31. Am J Physiol Gastrointest Liver Physiol. 2022. PMID: 35638693 Free PMC article.
-
Intraperitoneal delivery of acetate-encapsulated liposomal nanoparticles for neuroprotection of the penumbra in a rat model of ischemic stroke.Int J Nanomedicine. 2019 Mar 18;14:1979-1991. doi: 10.2147/IJN.S193965. eCollection 2019. Int J Nanomedicine. 2019. PMID: 30936698 Free PMC article.
References
Publication types
MeSH terms
Substances
Grants and funding
LinkOut - more resources
Full Text Sources
Other Literature Sources
Medical
Research Materials
