

Ancient DNA from lake sediments: bridging the gap between paleoecology and genetics
- PMID: 21272315
- PMCID: PMC3041685
- DOI: 10.1186/1471-2148-11-30
Ancient DNA from lake sediments: bridging the gap between paleoecology and genetics
Abstract
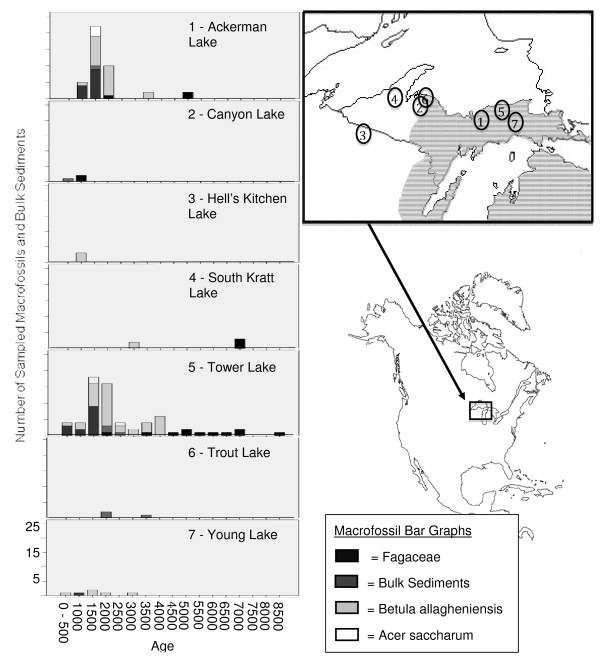
Background: Quaternary plant ecology in much of the world has historically relied on morphological identification of macro- and microfossils from sediments of small freshwater lakes. Here, we report new protocols that reliably yield DNA sequence data from Holocene plant macrofossils and bulk lake sediment used to infer ecological change. This will allow changes in census populations, estimated from fossils and associated sediment, to be directly associated with population genetic changes.
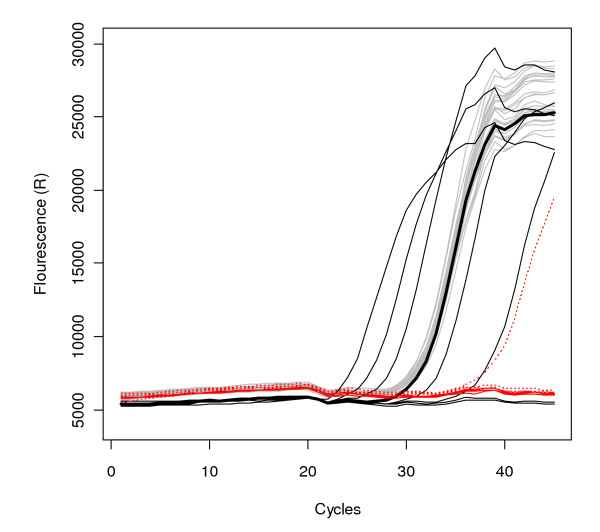
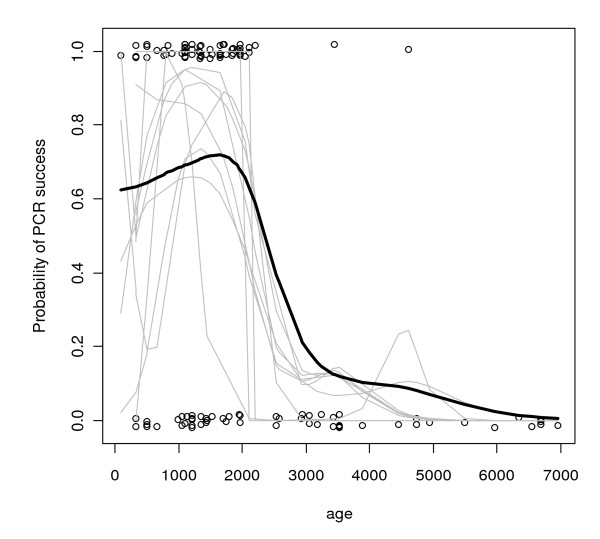
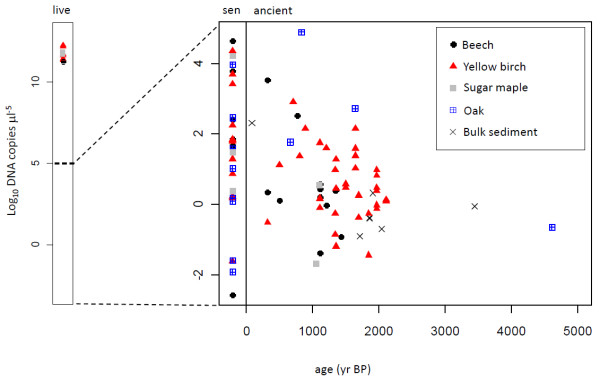
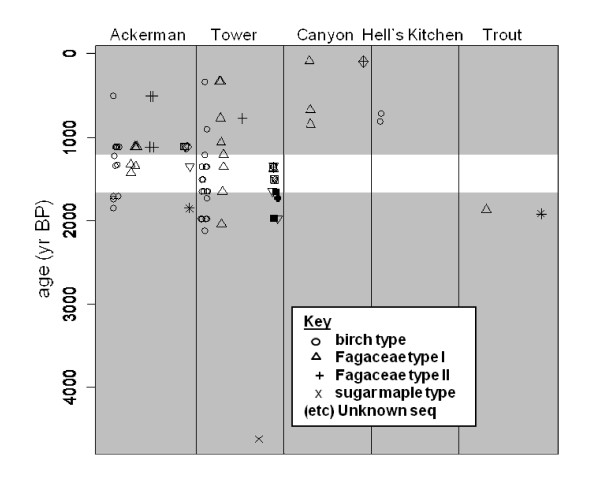
Results: We successfully sequenced DNA from 64 samples (out of 126) comprised of bulk sediment and seeds, leaf fragments, budscales, and samaras extracted from Holocene lake sediments in the western Great Lakes region of North America. Overall, DNA yields were low. However, we were able to reliably amplify samples with as few as 10 copies of a short cpDNA fragment with little detectable PCR inhibition. Our success rate was highest for sediments < 2000 years old, but we were able to successfully amplify DNA from samples up to 4600 years old. DNA sequences matched the taxonomic identity of the macrofossil from which they were extracted 79% of the time. Exceptions suggest that DNA molecules from surrounding nearby sediments may permeate or adhere to macrofossils in sediments.
Conclusions: An ability to extract ancient DNA from Holocene sediments potentially allows exciting new insights into the genetic consequences of long-term environmental change. The low DNA copy numbers we found in fossil material and the discovery of multiple sequence variants from single macrofossil extractions highlight the need for careful experimental and laboratory protocols. Further application of these protocols should lead to better understanding of the ecological and evolutionary consequences of environmental change.
Figures
References
-
- Woods KS, Davis MB. Paleoecology of range limits: beech in the upper peninsula of Michigan. Ecology. 1989;70:681–696. doi: 10.2307/1940219. - DOI
-
- Jackson ST, Booth RK. The role of late Holocene climate variability in the expansion of yellow birch in the western Great Lakes region. Diversity and Distributions. 2002;8:275–284. doi: 10.1046/j.1472-4642.2002.00152.x. - DOI
-
- Lyford ME, Jackson ST, Gray ST, Eddy RJ. Validating the use of woodrat (Neotoma) middens for documenting natural invasions. Journal of Biogeography. 2004;31:333–342. doi: 10.1046/j.0305-0270.2003.00987.x. - DOI
-
- Grimm E. Fire and other factors controlling Big Woods vegetation of Minnesota in the Mid-Nineteenth Century. Ecological Monographs. 1984;54:291–311. doi: 10.2307/1942499. - DOI
Publication types
MeSH terms
Substances
LinkOut - more resources
Full Text Sources
Other Literature Sources
Miscellaneous
