. 2011 Apr 15;508(2):204-11.
doi: 10.1016/j.abb.2011.01.006. Epub 2011 Jan 25.

Liver kinase B1 (LKB1) in the pathogenesis of UVB-induced murine basal cell carcinoma

Affiliations

Liver kinase B1 (LKB1) in the pathogenesis of UVB-induced murine basal cell carcinoma

Yevgeniya A Byekova et al. Arch Biochem Biophys. .

Abstract

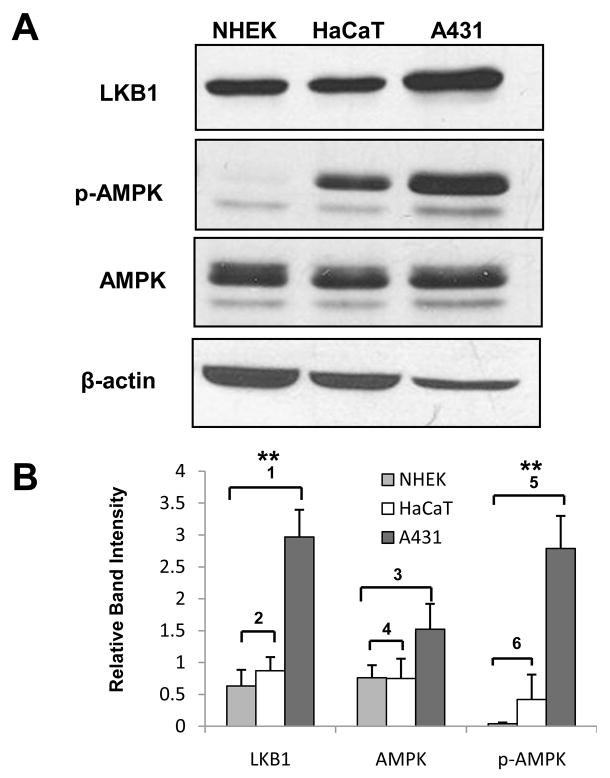
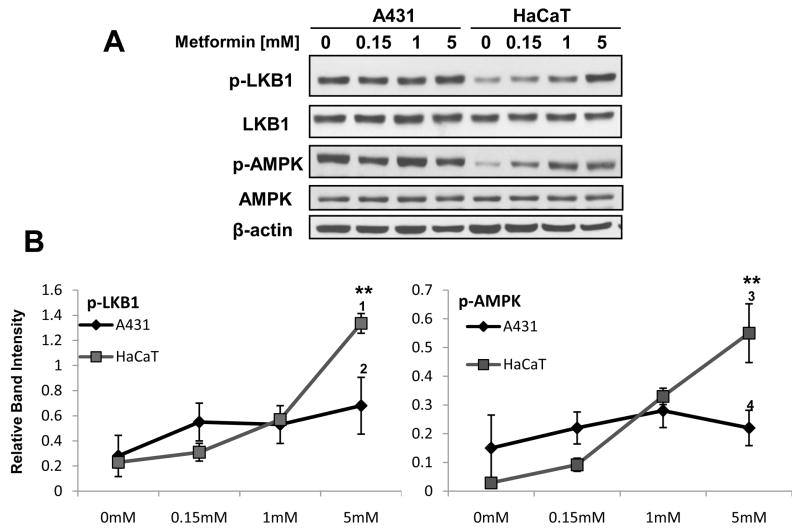
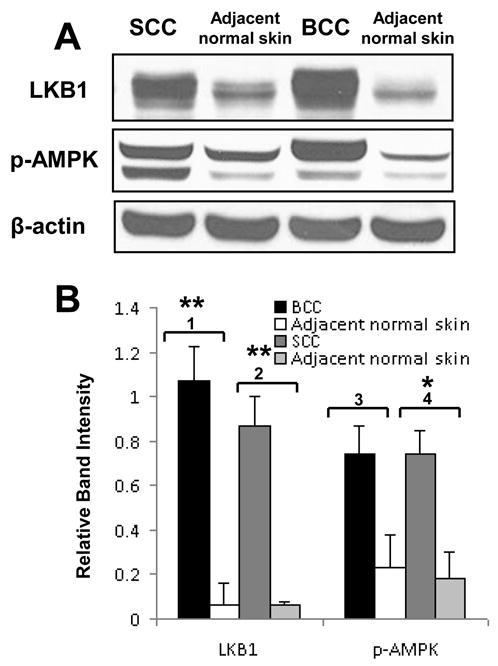
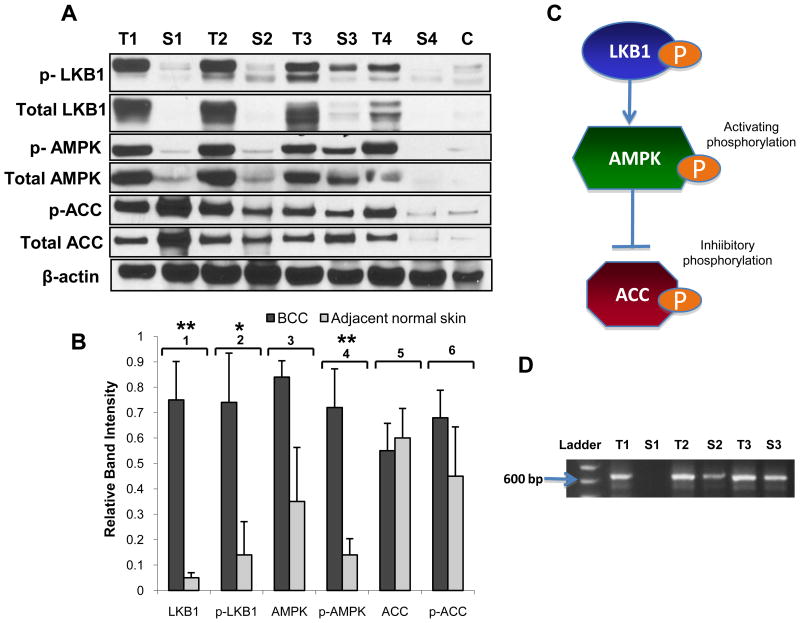
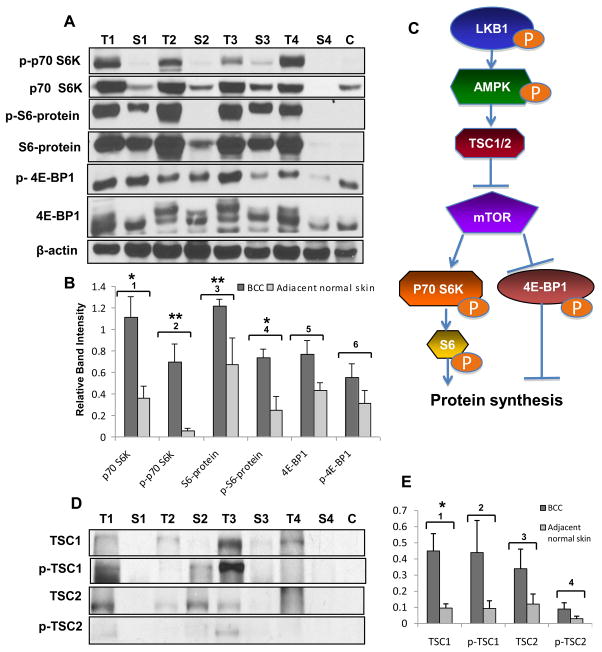
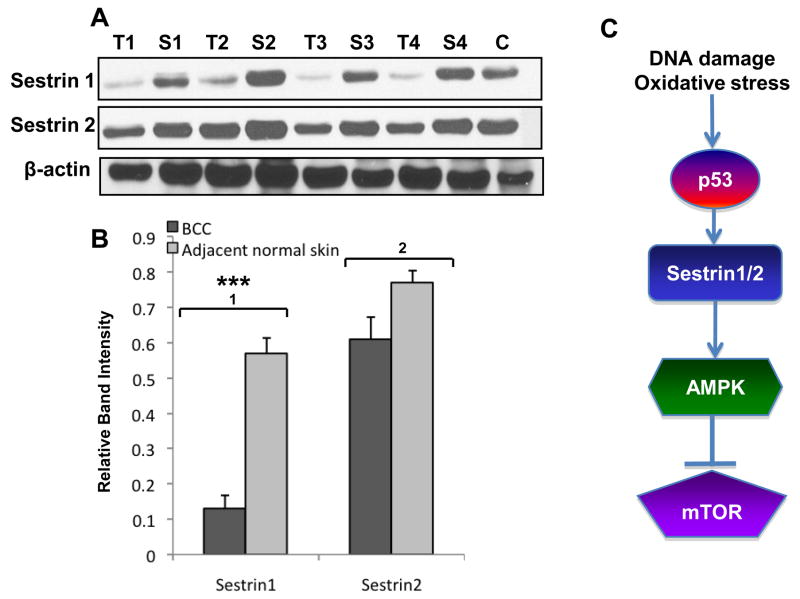
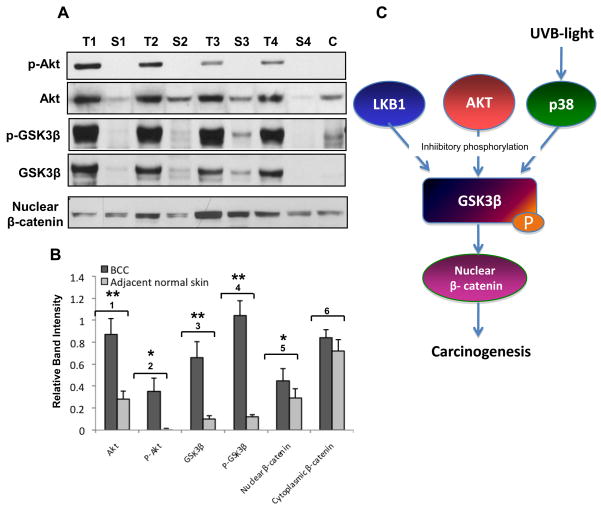
LKB1, a known tumor suppressor, is mutated in Peutz-Jeghers Syndrome (PJS). It is responsible for the enhanced cancer risk in patients with PJS. Dysregulation of LKB1-dependent signaling also occurs in various epithelial cancers. UVB alters the expression of LKB1, though its role in the pathogenesis of skin cancer is unknown. Here we describe upregulation of LKB1 expression in UVB-induced murine basal cell carcinoma (BCC) and in human skin tumor keratinocytes. AMP-kinase and acetyl Co-A carboxylase, the downstream LKB1 targets, are also enhanced in this neoplasm. In addition, p-Akt, a kinase which inactivates GSK3β by its phosphorylation, is enhanced in BCCs. Consistently, an accumulation of p-GSK3β and an increase in activated nuclear β-catenin are found. mTOR signaling, which is also inhibited by LKB1, remains upregulated in BCCs. However, a marked decrease in the expression of sestrins, which function as potent negative regulators of mTOR is observed. Metformin, a known chemical inducer of this pathway, was found effective in immortalized HaCaT keratinocytes, but failed to activate the LKB1-dependent signaling in human carcinoma A431 cells. Thus, our data show that the LKB1/AMPK axis fails to regulate mTOR pathway, and a complex regulatory mechanism exists for the persistent mTOR activation in murine BCCs.


Figures

Fig. 1
Fig. 1. Expression of LKB1 and p-AMPK is increased in A431 epidermoid carcinoma cells compared with normal and immortalized human keratinocytes
A. Western blot analysis of cell lysates prepared from NHEK, HaCaT, and A431 cell lines. Cells were grown to 70%–90% confluency and harvested. Cell lysates containing 50μg of total protein were analyzed on a 10% SDS-polyacrylamide gel, electroblotted onto nitrocellulose membrane, and probed with indicated antibodies. B. Quantification of LKB1, AMPK, and p-AMPK expression. Relative band intensities were measured using Image J software, normalized to the respective actin bands to account for sample loading variation, and shown as a bar graph. Each bars represent mean ± S.E. of three experiments. Significance between the expression of proteins in different cell lines was calculated using Student’s t-test: 1p=0.009, 2p=0.51, 3p=0.16, 4p=0.99, 5p=0.006, and 6p=0.39. P<0.01 were described as highly significant (**) whereas p<0.05 were described as significant (*).
Fig. 2
Fig. 2. Metformin enhances LKB1/AMPK signaling in immortalized human skin keratinocytes but not in A431 epidermoid carcinoma cells
A. Western blot analysis of metformin-treated A431 and HaCaT cells. Cells were grown to 70% confluency and exposed to metformin-containing serum-free medium for 24 hours at 37°C. When cells reached near-confluency, they were harvested and analyzed by Western blotting as described in Fig. 1. B. Quantification of LKB1, p-LKB1, AMPK, and p-AMPK expression. Relative band intensities were measured using Image J software, normalized to the respective actin band intensities to account for sample loading variation, and shown as a line graph. Each marker represents mean ± S.E. of three experiments. Significance between the expression of proteins in 5mM treatment group compared to no treatment group was calculated using Student’s t-test: 1p=0.0003, 2p=0.71, 3p=0.0072, and 4p=0.63. P<0.01 were described as highly significant (**).
Fig. 3
Fig. 3. LKB1 and p-AMPK expression is increased in UVB-induced murine squamous cell and basal cell carcinoma
A. Western blot analysis of tumor lysates prepared from UVB-induced murine BCCs SCCs. Adjacent normal skin from corresponding animals was used as control. Tissue lysated containing 50μg of total protein were analyzed by Western blotting as described in Fig. 1 and sequentially probed with anti-LKB1, anti-p-AMPK, and anti-β-actin antibodies. B. Quantification of LKB1 and p-AMPK expression in UVB-induced SCCs and BCCs. Relative band intensities were measured using Image J software and normalized to the respective actin band intensities to account for sample loading variation. Each bar represents mean ± S.E. of three tumors harvested from three different animals. Error bars indicate S.E. Significance between the expression of proteins in tumors and tumor-adjacent normal skin was calculated using Student’s t-test: 1p=0.01, 2p=0.003, 3p=0.23, and 4p=0.02. P<0.01 were described as highly significant (**) whereas p<0.05 were described as significant (*).
Fig. 4
Fig. 4. LKB1 expression and LKB1-dependent signaling is increased in UVB- induced murine BCCs
A. Western blot analysis of tumor sample lysates prepared from four different UVB-induced murine BCCs (T1-T4). Adjacent normal skin from corresponding animals (S1-S4) as well as non-UVB exposed skin from age-matched mice (C) were used as controls. Tissue lysates containing 50μg of total protein were analyzed by Western blotting as described in Fig. 1 and sequentially probed with anti-LKB1, anti-p-LKB1, anti-AMPK, anti-p-AMPK, and anti-β-actin antibodies. B. Quantification of LKB1 and p-AMPK expression in UVB-induced BCCs and control skin. Relative band intensities were measured using Image J software and normalized to the respective actin band intensities to account for sample loading variation. Each bar represents mean ± S.E. of four tumors harvested from four different mice. Error bars indicate S.E. Significance between the expression of proteins in tumors and tumor-adjacent normal skin was calculated using Student’s t-test: 1p=0.004, 2p=0.01, 3p=0.05, 4p=0.007, 5p=0.83, and 6p=0.34. P<0.01 were described as highly significant (**) whereas p<0.05 were described as significant (*). C. Schematic representation of LKB1/AMPK/ACC axis. Under conditions of cellular stress and nutrient deprivation, LKB1 directly phosphorylates AMPK and activates its kinase activity. p-AMPK in turn phosphorylates ACC resulting in its inactivation and increase in fatty acid oxidation D. Semiquantitative RT-PCR of mRNA isolated from three different murine BCCs (T1-T3) and adjacent normal skin (S1-S3). Total RNA from tumor and skin samples was extracted and amplified using the following primers: forward primer, 5′-CCCGAGCCGTTGGGCCTTTT-3′; reverse primer, 5′-CCTGGCTTGTCCGGCAGGTG-3′. A 625kb band was detected on gel-electrophoresis blot corresponding to the expected size of product for LKB1 using this set of primers.
Fig. 5
Fig. 5. mTOR signaling is upregulated in UVB-induced murine BCCs despite LKB1/AMPK activation
A. Western blot analysis of four different tumors (T1-T4), adjacent normal skin (S1-S4), and skin from age-matched non-UVB exposed control mice (C) was performed as described in Fig. 1. Blots were sequentially probed with anti-p-p70 S6K, anti-p70 S6K, anti-p-S6-protein, anti-S6-protein, anti-p-4E-BP1, anti-4E-BP1, and anti-β-actin antibodies. B. Quantification of mTOR signaling proteins in UVB-induced BCCs and controls was performed as described in Fig. 4. Each bar represents mean ± S.E. of four tumors harvested from four different mice. Error bars indicate S.E. Significance between the expression of proteins in tumors and tumor-adjacent normal skin was calculated using Student’s t-test: 1p=0.02, 2p=0.009, 3p=0.08,4p=0.02, 5p=0.05, 6p=0.22. P<0.01 were described as highly significant (**) whereas p<0.05 were described as significant (*). C. Schematic representation of LKB1/AMPK/mTOR signaling cascade. LKB1-mediated activation of AMPK results in the phosphorylation of TSC2 and subsequent inhibition of mTOR signaling. TSC2 inhibits phosphorylation of the two key translational regulators 4E-BP1 and S6 kinase with its target ribosomal protein S6. These events result in inhibition of protein synthesis and cell growth. D. Western blot analysis of four different tumors (T1-T4), adjacent normal skin (S1-S4), and skin from age-matched non-UVB exposed control mice (C) was performed as described in Fig. 1. Blots were sequentially probed with anti-TSC1, anti-p-TSC1, anti-TSC2, and anti-p-TSC2 antibodies. E. Quantification of TSC1/2 proteins in UVB-induced BCCs and controls was performed as described in Fig. 4. Each bar represents mean ± S.E. of four tumors harvested from four different mice. Error bars indicate S.E. Significance between the expression of proteins in tumors and tumor-adjacent normal skin was calculated using Student’s t-test: 1p=0.019, 2p=0.14, 3p=0.15 and 4p=0.2. P <0.05 were described as significant (*)
Fig. 6
Fig. 6. Sestrin1 expression is reduced in UVB-induced murine BCCs
A. Western blot analysis of four different tumors (T1–T4), adjacent normal skin (S1–S4), and skin from age-matched non UVB-exposed control mice (C) was performed as described in Fig. 1. Blots were sequentially probed with anti-sestrin1, anti-sestrin2, and anti-β-actin antibodies. B. Quantification of sestrins expression in UVB-induced BCCs and control skin was performed as described in Fig. 4. Each bar represents mean ± S.E. four tumors harvested from four different mice. Error bars indicate S.E. Significance between the expression of proteins in tumors and tumor-adjacent normal skin was calculated using Student’s t-test: 1p= 0.0003 and 2p=0.06. P < 0.001 was described as extremely significant (***). C. Schematic representation of sestrin-mediated inhibition of mTOR signaling. Activation of p53 by metabolic stress induces the expression of sestrin proteins. Sestrin1 and 2 preferentially activate AMPK towards inhibition of mTOR signaling.
Fig. 7
Fig. 7. LKB1 potentiates Wnt signaling in UVB-induced BCCs
A. Western blot analysis of four different tumors (T1–T4), adjacent normal skin (S1–S4), and skin from age-matched non-UVB exposed control mice (C) was performed as described in Fig. 1. Blots were sequentially probed with anti-p-Akt, anti-Akt, anti-p-GSK3β, anti-GSK3β and anti-β-actin (not shown) antibodies. Nuclear fraction of BCCs and control skin was extracted and probed with anti-β-catenin antibody. B. Quantification of Wnt signaling proteins in UVB-induced BCCs and controls was performed as described in Fig. 4. Each bar represents mean ± S.E. four tumors harvested from four different mice. Error bars indicate S.E. Significance between the expression of proteins in tumors and tumor-adjacent normal skin was calculated using Student’s t-test: 1p=0.01, 2p=0.03, 3p=0.009, 4p=0.0005, 5p=0.04, 6p=0.23. P values less than 0.01 were considered highly significant (**). P < 0.05 were described as significant (*). C. Schematic representation of Wnt/β-catenin signaling regulation. Activation of LKB1, Akt, and p38 kinases results in inhibitory phosphorylation of GSK3β, which results in translocation of β-catenin into the nucleus and transcriptional activation of multiple targets contributing to carcinogenesis.
Fig. 8
Fig. 8. MAPK signaling is upregulated both in UVB-induced BCCs and in normal skin adjacent to the tumors
A. Western blot analysis of four different tumors (T1–T4), adjacent normal skin (S1–S4), and skin from age-matched non-UVB exposed control mice (C) was performed as described in Fig. 1. Blots were sequentially probed with anti-p-ERK1/2, anti-ERK1/2, anti-p-p38, anti- p38, and anti-β-actin antibodies. B. Quantification of MAPK signaling proteins in UVB-induced BCCs and controls was performed as described in Fig. 4. Each bar represents mean ± S.E. four tumors harvested from four different mice. Error bars indicate S.E. Significance between the expression of proteins in tumors and tumor-adjacent normal skin was calculated using Student’s t-test: 1p=0.83, 2p=0.85, 3p=0.71,4p=.0.12

Similar articles

Cited by

References

    1. Christenson LJ, Borrowman TA, Vachon CM, Tollefson MM, Otley CC, Weaver AL, Roenigk RK. Incidence of Basal Cell and Squamous Cell Carcinoma in a population younger than 40 years. JAMA. 2005;294:681–690. - PubMed
    1. Telfer NR, Colver GB, Morton CA. Guidelines for the management of basal cell carcinoma. British Journal of Dermatology. 2008;159:35–48. - PubMed
    1. Richmond-Sinclair NM, Pandeya N, Ware RS, Neal RE, Williams GM, van der Pols JC, Green AC. Incidence of basal cell carcinoma multiplicity and detailed anatomic distribution: longitudinal study of an Australian population. Journal of Investigative Dermatology. 2009;129:323–328. - PubMed
    1. Oro AE, Higgins KM, Hu Z, Bonifas JM, Epstein EH, Jr, Scott MP. Basal cell carcinoma in mice overexpressing sonic hedgehog. Science. 1997;276:817–821. - PubMed
    1. Aszterbaum M, Epstein J, Oro A, Douglas V, LeBoit PE, Scott MP, Epstein EH., Jr Ultraviolet and ionizing radiation enhance the growth of BCC and trichoblastomas in patched heterozygous knockout mice. Nature. 1999;11:1285–1291. - PubMed

Publication types

MeSH terms

LinkOut - more resources