

Discriminant analysis of longitudinal cortical thickness changes in Alzheimer's disease using dynamic and network features
- PMID: 21272960
- PMCID: PMC3086988
- DOI: 10.1016/j.neurobiolaging.2010.11.008
Discriminant analysis of longitudinal cortical thickness changes in Alzheimer's disease using dynamic and network features
Abstract
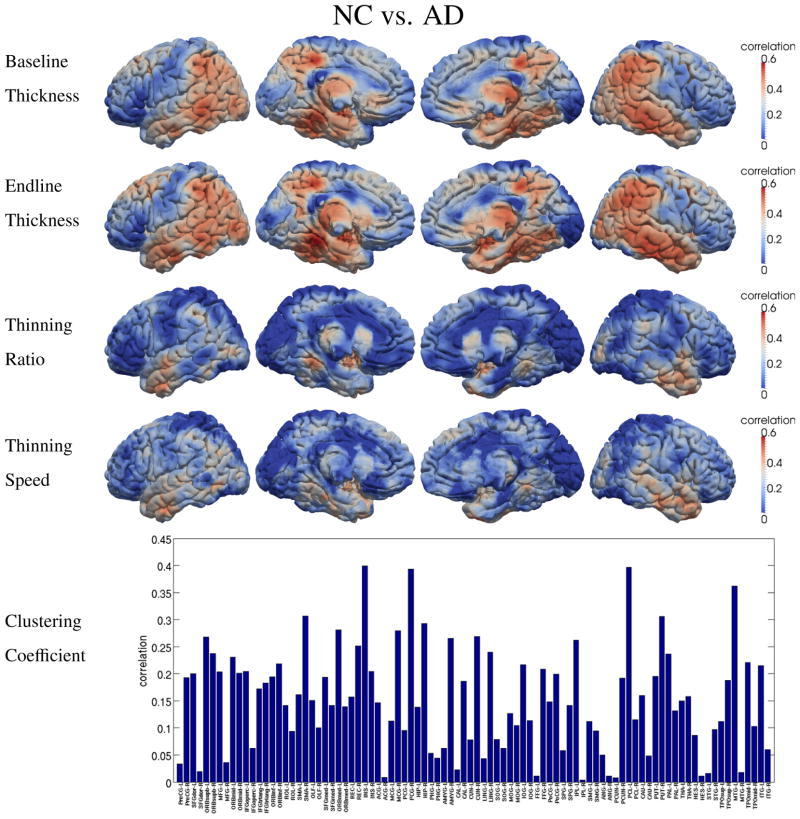
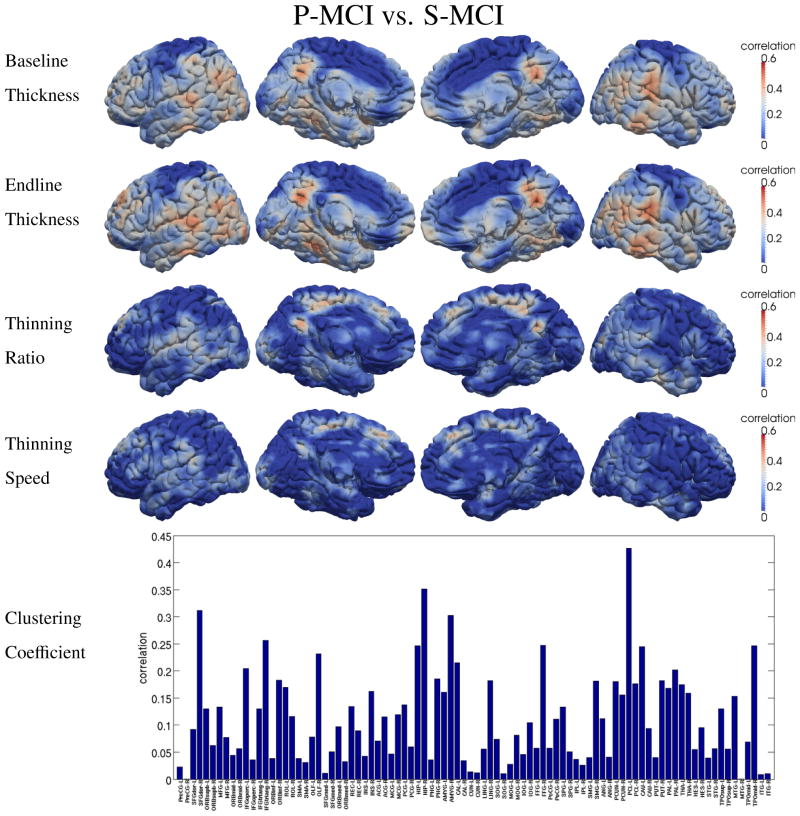
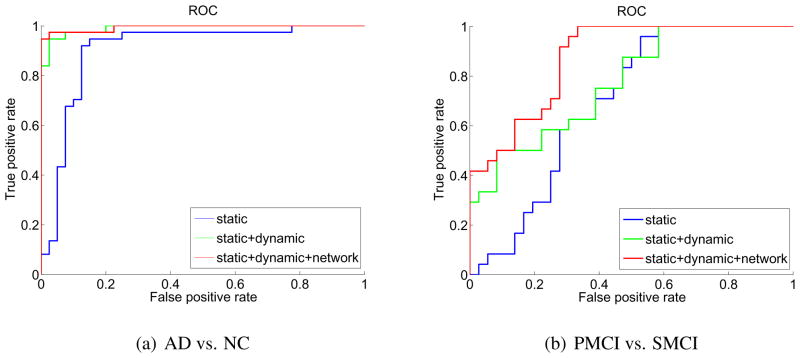
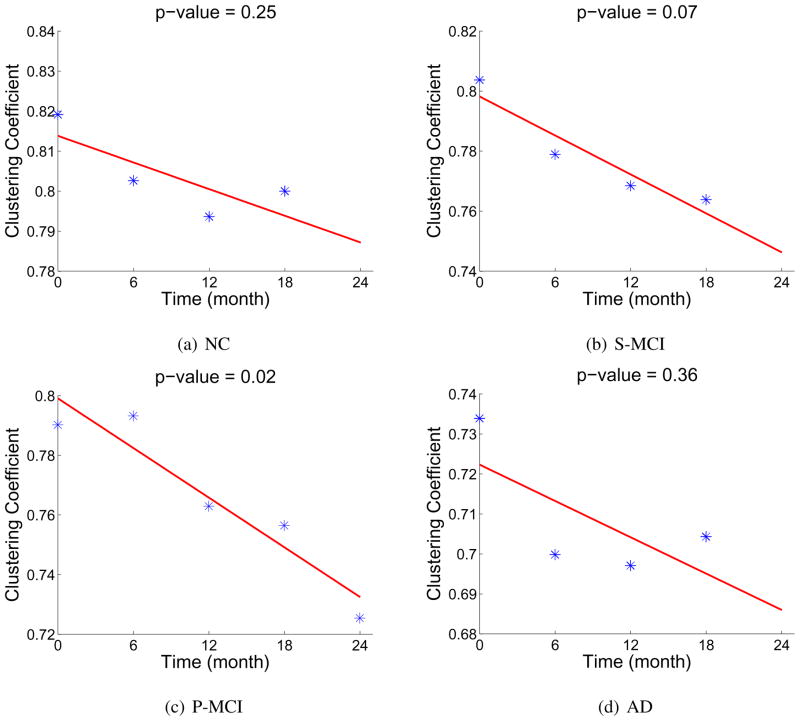
Neuroimage measures from magnetic resonance (MR) imaging, such as cortical thickness, have been playing an increasingly important role in searching for biomarkers of Alzheimer's disease (AD). Recent studies show that, AD, mild cognitive impairment (MCI) and normal control (NC) can be distinguished with relatively high accuracy using the baseline cortical thickness. With the increasing availability of large longitudinal datasets, it also becomes possible to study the longitudinal changes of cortical thickness and their correlation with the development of pathology in AD. In this study, the longitudinal cortical thickness changes of 152 subjects from 4 clinical groups (AD, NC, Progressive-MCI and Stable-MCI) selected from Alzheimer's Disease Neuroimaging Initiative (ADNI) are measured by our recently developed 4 D (spatial+temporal) thickness measuring algorithm. It is found that the 4 clinical groups demonstrate very similar spatial distribution of grey matter (GM) loss on cortex. To fully utilize the longitudinal information and better discriminate the subjects from 4 groups, especially between Stable-MCI and Progressive-MCI, 3 different categories of features are extracted for each subject, i.e., (1) static cortical thickness measures computed from the baseline and endline, (2) cortex thinning dynamics, such as the thinning speed (mm/year) and the thinning ratio (endline/baseline), and (3) network features computed from the brain network constructed based on the correlation between the longitudinal thickness changes of different regions of interest (ROIs). By combining the complementary information provided by features from the 3 categories, 2 classifiers are trained to diagnose AD and to predict the conversion to AD in MCI subjects, respectively. In the leave-one-out cross-validation, the proposed method can distinguish AD patients from NC at an accuracy of 96.1%, and can detect 81.7% (AUC = 0.875) of the MCI converters 6 months ahead of their conversions to AD. Also, by analyzing the brain network built via longitudinal cortical thickness changes, a significant decrease (p < 0.02) of the network clustering coefficient (associated with the development of AD pathology) is found in the Progressive-MCI group, which indicates the degenerated wiring efficiency of the brain network due to AD. More interestingly, the decreasing of network clustering coefficient of the olfactory cortex region was also found in the AD patients, which suggests olfactory dysfunction. Although the smell identification test is not performed in ADNI, this finding is consistent with other AD-related olfactory studies.
Copyright © 2012 Elsevier Inc. All rights reserved.
Figures
Similar articles
-
Baseline and longitudinal patterns of brain atrophy in MCI patients, and their use in prediction of short-term conversion to AD: results from ADNI.Neuroimage. 2009 Feb 15;44(4):1415-22. doi: 10.1016/j.neuroimage.2008.10.031. Epub 2008 Nov 5. Neuroimage. 2009. PMID: 19027862 Free PMC article.
-
Individual subject classification for Alzheimer's disease based on incremental learning using a spatial frequency representation of cortical thickness data.Neuroimage. 2012 Feb 1;59(3):2217-30. doi: 10.1016/j.neuroimage.2011.09.085. Epub 2011 Oct 8. Neuroimage. 2012. PMID: 22008371 Free PMC article.
-
Machine learning framework for early MRI-based Alzheimer's conversion prediction in MCI subjects.Neuroimage. 2015 Jan 1;104:398-412. doi: 10.1016/j.neuroimage.2014.10.002. Epub 2014 Oct 12. Neuroimage. 2015. PMID: 25312773 Free PMC article.
-
Structural magnetic resonance imaging for the early diagnosis of dementia due to Alzheimer's disease in people with mild cognitive impairment.Cochrane Database Syst Rev. 2020 Mar 2;3(3):CD009628. doi: 10.1002/14651858.CD009628.pub2. Cochrane Database Syst Rev. 2020. PMID: 32119112 Free PMC article.
-
A review on Alzheimer's disease classification from normal controls and mild cognitive impairment using structural MR images.J Neurosci Methods. 2023 Jan 15;384:109745. doi: 10.1016/j.jneumeth.2022.109745. Epub 2022 Nov 14. J Neurosci Methods. 2023. PMID: 36395961 Review.
Cited by
-
Discriminative Learning for Alzheimer's Disease Diagnosis via Canonical Correlation Analysis and Multimodal Fusion.Front Aging Neurosci. 2016 May 17;8:77. doi: 10.3389/fnagi.2016.00077. eCollection 2016. Front Aging Neurosci. 2016. PMID: 27242506 Free PMC article.
-
Graph theoretic analysis of structural connectivity across the spectrum of Alzheimer's disease: The importance of graph creation methods.Neuroimage Clin. 2015 Jan 13;7:377-90. doi: 10.1016/j.nicl.2015.01.007. eCollection 2015. Neuroimage Clin. 2015. PMID: 25984446 Free PMC article.
-
Modeling and prediction of clinical symptom trajectories in Alzheimer's disease using longitudinal data.PLoS Comput Biol. 2018 Sep 14;14(9):e1006376. doi: 10.1371/journal.pcbi.1006376. eCollection 2018 Sep. PLoS Comput Biol. 2018. PMID: 30216352 Free PMC article.
-
Topological properties of individual gray matter morphological networks in identifying the preclinical stages of Alzheimer's disease: a preliminary study.Quant Imaging Med Surg. 2023 Aug 1;13(8):5258-5270. doi: 10.21037/qims-22-1373. Epub 2023 Jul 10. Quant Imaging Med Surg. 2023. PMID: 37581056 Free PMC article.
-
Brain network disintegration as a final common pathway for delirium: a systematic review and qualitative meta-analysis.Neuroimage Clin. 2019;23:101809. doi: 10.1016/j.nicl.2019.101809. Epub 2019 Apr 3. Neuroimage Clin. 2019. PMID: 30981940 Free PMC article.
References
-
- Chetelat G, Landeau B, Eustache F, Mezenge F, Viader F, de la Sayette V, Desgranges B, Baron JC. Using voxel-based morphometry to map the structural changes associated with rapid conversion in MCI: A longitudinal MRI study. NeuroImage. 2005;27 (4):934–946. - PubMed
-
- Crofts J, Higham D, Bosnell R, Jbabdi S, Matthews P, Behrens T, Johansen-Berg H. Neuroimage D, W. The Psychological Corporation; San Antonio, TX: 1987. Network analysis detects changes in the contralesional hemisphere following stroke. Epub ahead of print 2010. Wechsler Memory Scale-Revised Manual. - PMC - PubMed
Publication types
MeSH terms
Grants and funding
LinkOut - more resources
Full Text Sources
Medical
