. 2011 Jun 1;90(3):493-502.
doi: 10.1093/cvr/cvr025. Epub 2011 Jan 27.

The relationship between arrhythmogenesis and impaired contractility in heart failure: role of altered ryanodine receptor function

Affiliations

The relationship between arrhythmogenesis and impaired contractility in heart failure: role of altered ryanodine receptor function

Andriy E Belevych et al. Cardiovasc Res. .

Abstract

Aims: In heart failure (HF), abnormal myocyte Ca(2+) handling has been implicated in cardiac arrhythmias and contractile dysfunction. In the present study, we investigated the relationships between Ca(2+) handling, reduced myocyte contractility, and enhanced arrhythmogenesis during HF progression in a canine model of non-ischaemic HF.

Methods and results: Key Ca(2+) handling parameters were determined by measuring cytosolic and intra-sarcoplasmic reticulum (SR) [Ca(2+)] in isolated ventricular myocytes at different stages of HF. The progression of HF was associated with an early and continuous increase in ryanodine receptor (RyR2)-mediated SR Ca(2+) leak. The increase in RyR2 activity was paralleled by an increase in the frequency of diastolic spontaneous Ca(2+) waves (SCWs) in HF myocytes under conditions of β-adrenergic stimulation. In addition to causing arrhythmogenic-delayed afterdepolarizations, SCWs decreased the amplitude of subsequent electrically evoked Ca(2+) transients by depleting SR Ca(2+). At late stages of HF, Ca(2+) release oscillated essentially independent of electrical pacing. The increased propensity for the generation of SCWs in HF myocytes was attributable to reduced ability of the RyR2 channels to become refractory following Ca(2+) release. The progressive alterations in RyR2 function and Ca(2+) cycling in HF myocytes were associated with sequential modifications of RyR2 by CaMKII-dependent phosphorylation and thiol oxidation.

Conclusion: These findings suggest that destabilized RyR2 activity due to excessive CaMKII phopshorylation and oxidation resulting in impaired post-release refractoriness is a common mechanism involved in arrhythmogenesis and contractile dysfunction in the failing heart.


Figures

Figure 1
Figure 1
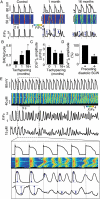
Time course of decrease in cytosolic Ca2+ transient during HF progression. (A) Representative line-scan images and corresponding profiles of cytosolic Ca2+ transients ([Ca2+]c) evoked by electrical field stimulation at 0.3 Hz in control (0 months of TP) and HF myocytes at the indicated duration of TP. (B) Average amplitudes and time constants of exponential fit of decaying phase of [Ca2+]c obtained in control and in HF myocytes. (C) Representative traces of [Ca2+]c and Ca2+ currents (ICa) evoked by depolarizing steps from −50 to 0 mV in control and HF myocytes. (D) Average amplitudes of [Ca2+]c and average peak density of ICa recorded in control and HF groups. (E) Representative traces of Ca2+ transients evoked by 10 mM caffeine recorded in control and HF patch-clamped myocytes. (F) Average amplitudes and time constants of decay of caffeine-induced Ca2+ transients ([Ca2+]Caff) recorded in control and HF groups. *P < 0.05 vs. control; P < 0.05 vs. 1 MHF.
Figure 2
Figure 2
Time-dependence of increase in the SR Ca2+ leak during HF progression (A) Representative line-scan images of Ca2+ sparks recorded in permeabilized control and HF myocytes at the indicated time stages of HF. (B) Time-dependent profiles of intra-SR Fluo-5N fluorescence recorded in the presence of the SERCA inhibitor thapsigargin (Tg, 10 μM) in control and HF myocytes. The decline of Fluo-5N signal in the presence of Tg was fitted to a monoexponential function. (C) Representative time-dependent profiles of Fluo-5N fluorescence used to calculate SR Ca2+ uptake were recorded in control and HF myocytes in the presence of the RyR2 inhibitor ruthenium red (30 μM). SR Ca2+ uptake was initiated by the addition of 500 nM Ca2+. (D) Average Ca2+ spark frequency and average SR Ca2+ leak rate, calculated from exponential time constants obtained as shown in (B). (E) Average time constants of the SR Ca2+ uptake recorded in control and HF myocytes. (F) Amplitudes of Ca2+ transients ([Ca2+]c) recorded in control and HF field-stimulated myocytes are plotted against SR Ca2+ leak rates measured in cells isolated from the hearts with matched left ventricular fractional shortening. Data were fit to a logistic function with a leak rate of 2.42 ± 0.07 × 10⁻³ s−1 corresponding to half-maximal changes in [Ca2+]c amplitude. The grey area indicates the region (stability zone) where changes in SR Ca2+ leak rate are not associated with alterations in [Ca2+]c amplitude. Each data point represents data collected from one to three hearts. *P < 0.05 vs. control; P < 0.05 vs. 1 MHF; P < 0.05 vs. 4 MHF.
Figure 3
Figure 3
Diastolic Ca2+ waves induce membrane depolarization and affect myocyte contractility in HF. (A) Representative recordings of membrane potential with corresponding line-scan images and temporal profiles of Fluo-3 fluorescence recorded in control and HF myocytes at the indicated HF stages stimulated at 0.5 Hz in the presence of 100 nM ISO. Arrows indicate DADs. (B) Frequency of DADs were calculated in control (n = 12), in 1 MHF (n = 18), and 16+ MHF (n = 7) myocytes. (C) Average amplitudes of [Ca2+]c recorded in control (n = 6) and in HF myocytes from 1 (n = 10) and 16+ (n = 7) month groups. (D) Amplitudes of [Ca2+]c that were preceded with SCW in diastolic phase were normalized to those that did not display SCWs during the preceding diastolic interval. Data were recorded in HF myocytes (n = 9) as shown in (A). (E) Representative recordings of membrane potential, line-scan image and temporal profile of Fluo-3 fluorescence, and myocyte shortening (assessed from the line-scan image) obtained in an HF myocyte from the 16+ MHF group, stimulated at 1 Hz in the presence of 100 nM ISO. Part of the figure is scaled up to better illustrate the disrupting effect of SCWs (marked with white arrows) on systolic Ca2+ release and cellular shortening. Similar observations were made in 10% (one out of 10) myocytes from early-stage (1 month) HF and in 46% (five out of 11) myocytes from late-stage (two out of five myocytes from 4 MHF and three out of six myocytes from 16+ MHF) HF. None of control myocytes (n = 8) displayed such behaviour. Up–down arrows indicate the amplitude of Ca2+ transient and cellular shortening. *P < 0.05.
Figure 4
Figure 4
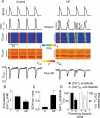
Diastolic SCWs reduce end-diastolic SR Ca2+. (A) Representative traces of ‘typical’ control APs used as a voltage command and corresponding line-scan images and temporal profiles of Rhod-2 and Fluo-5N fluorescence recorded in control and HF myocytes. (B) Average values of end-diastolic [Ca2+]SR [marked by red circles in (A)] recorded in control (n = 8) and HF (n = 9) myocytes. (C) Average frequency of SCW recorded in control (n = 12) and HF (n = 15) myocytes using the AP-clamp stimulation protocol. (D) Amplitudes of [Ca2+]c and end-diastolic [Ca2+]SR that were preceded with SCW in the diastolic phase were normalized to those that did not display SCW during the preceding diastolic interval. Data were recorded in HF myocytes (n = 5–9) as shown in (A). *P < 0.05.
Figure 5
Figure 5
Ca2+ signalling refractoriness in control and HF myocytes. (A) Representative traces of ‘typical’ control APs used as voltage commands and corresponding line-scan images and temporal profiles of Rhod-2 and Fluo-5N fluorescence recorded in control and HF myocytes. (B) Average values of diastolic [Ca2+]SR at the time of SCW initiation (threshold [Ca2+]SR) recorded in control and HF myocytes. (C) Average time delay between maximal SR Ca2+ depletion during the last of the 20 AP-clamp stimuli and the onset of SCW recorded in control and HF myocytes. (D) Average rate of SR Ca2+ replenishing measured in control and HF myocytes. (E) Latency to SCWs (L) recorded in control and HF myocytes was measured as the time interval from the point when SR Ca2+ restored to 99% (five times exponential time constant) from depletion caused by the last stimulus to the point of SCW initiation. (F) Refractoriness factors (R = latency × threshold [Ca2+]SR) were calculated for control and HF myocytes. Data presented in this figure were recorded in eight control and seven HF myocytes. *P < 0.05 vs. control.
Figure 6
Figure 6
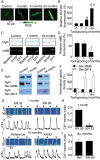
Oxidation and phosphorylation status of ryanodine receptors (RyR2s) in control and during HF progression. (A) Representative images of control and HF myocytes at the indicated HF stages loaded with an ROS-sensitive fluorescent indicator DCFDA. (B) Relative normalized DCFDA fluorescence from control myocytes (n = 47) and HF myocytes from 1 (n = 131), 4 (n = 24), and 16+ (n = 16) month groups. (C) Representative Coomassie-stained gels (upper panels) and mBB fluorescence intensity (lower panels) of RyR2s from control and HF hearts at 1 and 16 MHF measured under baseline conditions, in the presence of the oxidizing agent DTDP (0.2 mM), and in the presence of the reducing agent DTT (10 mM). (D) Relative free thiol content of RyR2s from control samples (n = 14) and samples from 1 (n = 9) and 16+ (n = 5) MHF groups. (E) Representative western blots showing phosphorylation of RyR2s at Ser-2808 (PKA-dependent) and Ser-2814 (CaMKII-dependent) phosphorylation sites in control and in 1 and 16 MHF measured with phosphor-specific antibodies. (F) Data pooled for Ser-2808 from six to 10 experiments and for Ser-2814 from four to nine experiments. (G) Representative line-scan images and temporal profiles of Rhod-2 fluorescence recorded in 1 MHF myocytes field-stimulated at 0.5 Hz in the presence of 100 nM ISO. Cells were pre-treated for at least 30 min with 1 µM KN 93, an inhibitor of CaMKII, or 1 µM KN 92, an inactive structural analogue of KN 93. Arrows indicate the time of electrical stimulation. (H) Average frequency of Ca2+ waves in 1 HF myocytes measured in the presence of 1 µM KN 92 (n= 22) and 1 µM KN 93 (n = 17). (I) Representative line-scan images and temporal profiles of Rhod-2 fluorescence recorded in 16 MHF myocytes field-stimulated at 0.3 Hz in the presence of 100 nM ISO. (J) Average frequency of Ca2+ waves in 16+ MHF myocytes was measured in the absence (n = 17) and in the presence (n = 11) of 1 µM KN 93. *P < 0.05 vs. control or KN 92 group; P < 0.05 vs. 1 MHF; P < 0.05 vs. 4 MHF.

Comment in

References

    1. Mozaffarian D, Anker SD, Anand I, Linker DT, Sullivan MD, Cleland JG, et al. Prediction of mode of death in heart failure: the Seattle Heart Failure Model. Circulation. 2007;116:392–398. doi:10.1161/CIRCULATIONAHA.106.687103. - DOI - PubMed
    1. Severs NJ, Bruce AF, Dupont E, Rothery S. Remodelling of gap junctions and connexin expression in diseased myocardium. Cardiovasc Res. 2008;80:9–19. doi:10.1093/cvr/cvn133. - DOI - PMC - PubMed
    1. Mann DL. Mechanisms and models in heart failure: a combinatorial approach. Circulation. 1999;100:999–1008. - PubMed
    1. Pogwizd SM, Bers DM. Cellular basis of triggered arrhythmias in heart failure. Trends Cardiovasc Med. 2004;14:61–66. doi:10.1016/j.tcm.2003.12.002. - DOI - PubMed
    1. Ter Keurs HE, Boyden PA. Calcium and arrhythmogenesis. Physiol Rev. 2007;87:457–506. doi:10.1152/physrev.00011.2006. - DOI - PMC - PubMed

Publication types

MeSH terms

Substances