. 2011 Apr;105(4):1603-19.
doi: 10.1152/jn.00532.2010. Epub 2011 Jan 27.

Relationships among low-frequency local field potentials, spiking activity, and three-dimensional reach and grasp kinematics in primary motor and ventral premotor cortices

Affiliations

Relationships among low-frequency local field potentials, spiking activity, and three-dimensional reach and grasp kinematics in primary motor and ventral premotor cortices

Arjun K Bansal et al. J Neurophysiol. 2011 Apr.

Erratum in

  • J Neurophysiol. 2011 Sep;106(3):1599

Abstract

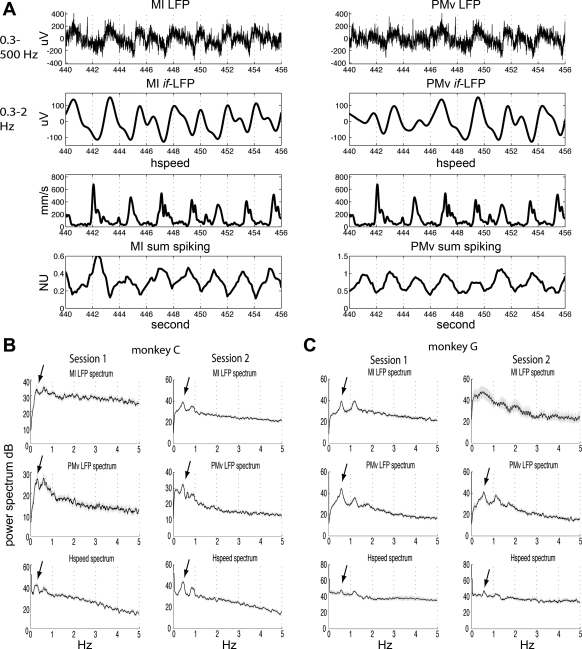
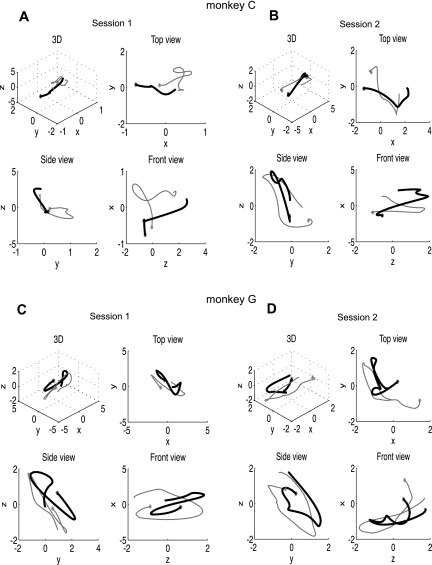
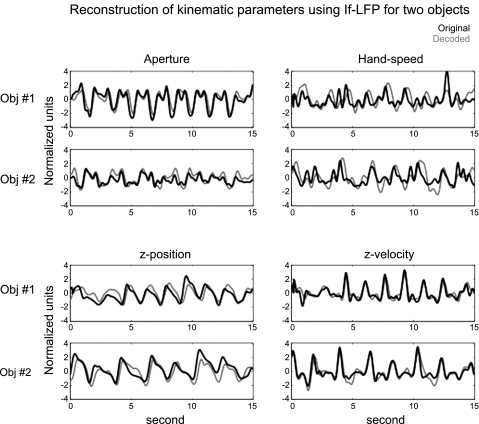
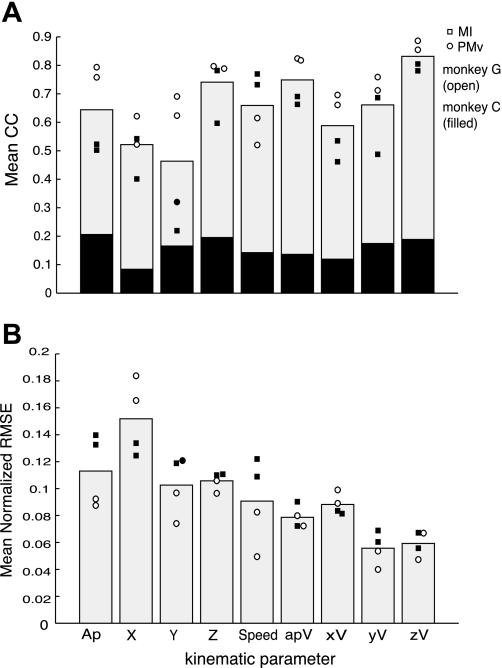
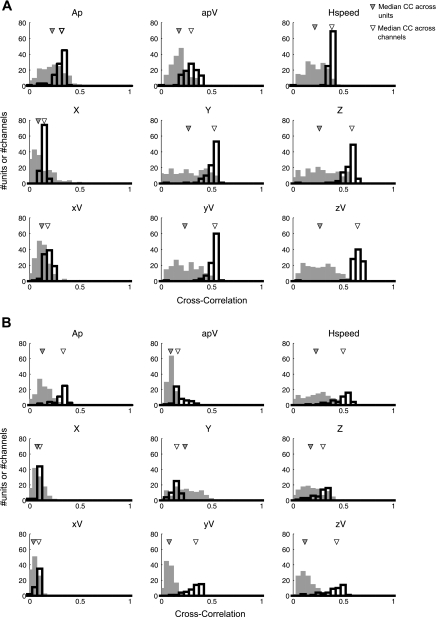
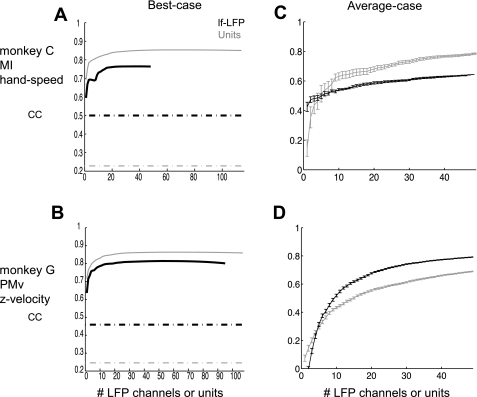
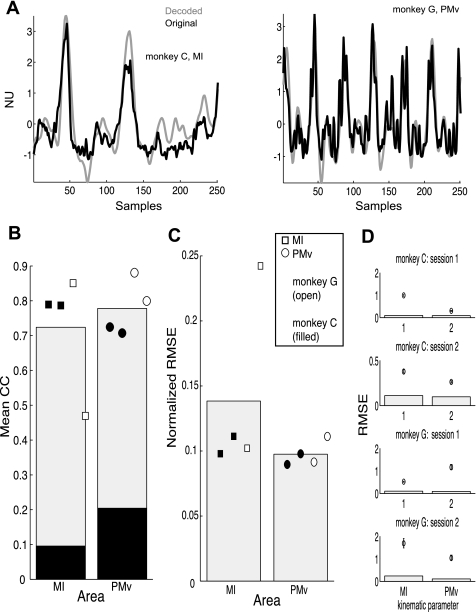
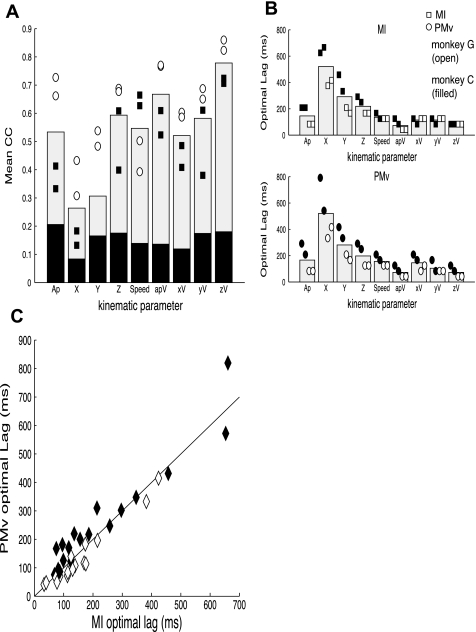
A prominent feature of motor cortex field potentials during movement is a distinctive low-frequency local field potential (lf-LFP) (<4 Hz), referred to as the movement event-related potential (mEP). The lf-LFP appears to be a global signal related to regional synaptic input, but its relationship to nearby output signaled by single unit spiking activity (SUA) or to movement remains to be established. Previous studies comparing information in primary motor cortex (MI) lf-LFPs and SUA in the context of planar reaching tasks concluded that lf-LFPs have more information than spikes about movement. However, the relative performance of these signals was based on a small number of simultaneously recorded channels and units, or for data averaged across sessions, which could miss information of larger-scale spiking populations. Here, we simultaneously recorded LFPs and SUA from two 96-microelectrode arrays implanted in two major motor cortical areas, MI and ventral premotor (PMv), while monkeys freely reached for and grasped objects swinging in front of them. We compared arm end point and grip aperture kinematics' decoding accuracy for lf-LFP and SUA ensembles. The results show that lf-LFPs provide enough information to reconstruct kinematics in both areas with little difference in decoding performance between MI and PMv. Individual lf-LFP channels often provided more accurate decoding of single kinematic variables than any one single unit. However, the decoding performance of the best single unit among the large population usually exceeded that of the best single lf-LFP channel. Furthermore, ensembles of SUA outperformed the pool of lf-LFP channels, in disagreement with the previously reported superiority of lf-LFP decoding. Decoding results suggest that information in lf-LFPs recorded from intracortical arrays may allow the reconstruction of reach and grasp for real-time neuroprosthetic applications, thus potentially supplementing the ability to decode these same features from spiking populations.


Figures

Fig. 1.
Fig. 1.
Example traces and power spectra. a: example traces of raw local field potential (LFP; 0.3–500 Hz), and low-frequency local field potential (lf-LFP; 0.3–2 Hz) recorded on 1 electrode in each of primary motor cortex (MI) and ventral premotor (PMv) of monkey C during the 3-dimensional reaching and grasping task. Also shown are measured hand-speed (hspeed) and summed spiking in MI and PMv. Dashed lines are for alignment across panels. b: comparison of MI, PMv LFP (unfiltered, 0.3–500 Hz), and hand-speed spectra (unfiltered, sampled at 240 Hz) for 2 sessions from monkey C. Arrows indicate the peak in the low-frequency (<1 Hz) range. c: similar comparison of MI, PMv LFP, and hand-speed spectra for 2 sessions from monkey G (note: MI, session 2 was noisier in this monkey).
Fig. 2.
Fig. 2.
Examples of reconstructed 3-dimensional hand end point trajectories (actual in thick black; reconstructed in thin gray) from each of the 4 data sessions. Star indicates start location of the trajectory. a and b: correspond to a trajectory each from sessions 1 and 2, respectively, from monkey C. c and d: correspond to a trajectory each from sessions 1 and 2, respectively, from monkey G. Axes are in normalized units (mean subtracted and divided by standard deviation for each dimension for display purposes).
Fig. 3.
Fig. 3.
Reconstruction of kinematic parameters using lf-LFP for 2 objects (obj). Decoded (gray) and original (black) aperture, hand-speed, z-position, and z-velocity for a 15-s long subsection for reaches and grasps to 2 different objects by monkey G during session 2 (PMv lf-LFPs were used).
Fig. 4.
Fig. 4.
Summary of optimal decoding performance for each session using the Kalman filter. Refer to Table 1 for complete list of values. a: maximum cross-correlation (CC) of original and decoded kinematics in 2 monkeys in 2 sessions using lf-LFP from all recorded LFP channels from 2 areas. The cross-correlation for the cortical area that gave better cross-correlation for each session for each kinematic parameter is plotted (open markers: monkey C; filled markers: monkey G; squares: MI; circles: PMv). Bars represent mean (across 2 sessions in each of the 2 monkeys) cross-correlation for each of the 9 kinematic parameters. Black bars represent the maximal range of the cross-correlation that was observed by using a phase-randomized lf-LFP signal (see methods) for decoding the same kinematics for all the sessions (100 iterations × 4 sessions). b: assessing the decoding performance using root mean squared error (plotted as a fraction of the range of the observed kinematic parameter). Root mean squared error (RMSE) is reported for the area that gave the best cross-correlation value for that session. Supplementary Fig. 1b plots the bootstrap significance estimates for the root mean squared errors.
Fig. 5.
Fig. 5.
Comparison of individual units vs. individual channel decoding performance. a: distribution of cross-correlations when using individual units (gray) vs. using individual lf-LFP channels (open). Inverted triangles represent the corresponding medians of the distributions. For all comparisons, the medians were significantly different (P < 10∧−6, Kruskal-Wallis test) (monkey G, session 1, PMv array). b: similar to a, but for monkey C, session 2, MI array. For all comparisons, the medians were significantly different (P < 10∧−5, Kruskal-Wallis test; except x-position, where P < 0.02).
Fig. 6.
Fig. 6.
Best-case and average-case decoding performance. a: comparison of improvements in individual unit (thin gray) vs. individual channel (thick black) decoding performance when using a greedy procedure (monkey C, MI, Hand-speed). b: monkey G, PMv, z-velocity. Dashed lines represent the median of the cross-correlation when using individual units (thin gray) or individual (thick, black) channels for that kinematic parameter for that session. c and d: average-case decoding compared with best-case decoding. c and d are similar to a and b but picking 100 random subsets of LFP channels or units and computing their average decoding performance instead of using the greedy procedure. Error-bars plot ± 1 SE. c: monkey C, MI, hand-speed. d: monkey G, PMv, z-velocity.
Fig. 7.
Fig. 7.
Summary of decoding summed spiking using the lf-LFP. a: example of decoding summed spiking using the lf-LFP. Black lines: original summed spiking; gray lines: decoded summed spiking. Left: monkey C, session 1, MI. Right: monkey G, session 2, PMv. b: summary of summed spiking decoding performance: cross-correlation of original and decoded summed spiking in 2 monkeys in 2 sessions using lf-LFP from all recorded LFP channels from 2 areas. (filled markers: monkey C; open markers: monkey G; squares: MI; circles: PMv). Bars represent mean cross-correlation across monkeys and across sessions for each area. Black bars represent the maximal range of the cross-correlation that was observed by using a phase-randomized lf-LFP signal for decoding the summed spiking for all the sessions (100 iterations × 4 sessions). c: root mean squared error of summed spiking decoding. d: bootstrap significance error estimates of summed spiking decoding. NU, normalized units.
Fig. 8.
Fig. 8.
Summary of influence of lag and optimal lags. a: kinematic decoding performance using Kalman filter when using time causal lags only (<= 0 ms, i.e., LFP preceding kinematics). Cross-correlation of original and decoded kinematics in 2 monkeys in 2 sessions using lf-LFP from all recorded LFP channels from 2 areas is shown. The cross-correlation for the area that gave better cross-correlation for each session for each kinematic parameter is plotted (filled markers: monkey C; open markers: monkey G; squares: MI; circles: PMv). Bars represent mean cross-correlation for each kinematic parameter across monkeys and across sessions. Black bars represent the maximal range of the cross-correlation that was observed by using a phase-randomized lf-LFP signal for decoding the same kinematics for all the sessions (100 samples × 4 sessions). b: lags that yielded the optimal decoding performance in MI (top) and PMv (bottom) for each kinematic parameter in each session. c: comparison of lags that yielded optimal decoding performance in each area. The optimal lags were not significantly different between MI and PMv (P > 0.94). For each diamond, the x-axis indicates the optimal lag in MI and the y-axis indicates the optimal lag in PMv for a particular kinematic parameter in 1 session. Data from both sessions in each monkey are plotted.
Fig. 9.
Fig. 9.
Comparison of individual unit vs. individual channel optimal lags (for all kinematic variables in a session). a: monkey C, session 1, MI: distribution of channels/units with different optimal lags. Inverted triangles represent median optimal lag (gray: units; clear: channels). Note that the increased fractions at the edges are an artifact of the binning. b: similar to a, but for monkey G, session 1, PMv.

Comment in

Similar articles

Cited by

References

    1. Andersen RA, Musallam S, Pesaran B. Selecting the signals for a brain-machine interface. Curr Opin Neurobiol 14: 720–726, 2004 - PubMed
    1. Artemiadis P, Shakhnarovich G, Vargas-Irwin C, Black MJ, Donoghue JP. Decoding grasp aperture from motor-cortical population activity. The 3rd International IEEE EMBS Conference on Neural Engineering, pp. 518–521
    1. Asher I, Stark E, Abeles M, Prut Y. Comparison of direction and object selectivity of local field potentials and single units in macaque posterior parietal cortex during prehension. J Neurophysiol 97: 3684–3695, 2007 - PubMed
    1. Belitski A, Gretton A, Magri C, Murayama Y, Montemurro MA, Logothetis NK, Panzeri S. Low-frequency local field potentials and spikes in primary visual cortex convey independent visual information. J Neurosci 28: 5696–5709, 2008 - PMC - PubMed
    1. Bradberry TJ, Gentili RJ, Contreras-Vidal JL. Reconstructing three-dimensional hand movements from noninvasive electroencephalographic signals. J Neurosci 30: 3432–3437, 2010 - PMC - PubMed

Publication types

LinkOut - more resources