. 2011 Mar;32(3):548-55.
doi: 10.3174/ajnr.A2330. Epub 2011 Jan 27.

Reproducibility of single-subject functional connectivity measurements

Affiliations

Reproducibility of single-subject functional connectivity measurements

J S Anderson et al. AJNR Am J Neuroradiol. 2011 Mar.

Abstract

Background and purpose: Measurements of resting-state functional connectivity have increasingly been used for characterization of neuropathologic and neurodevelopmental populations. We collected data to characterize how much imaging time is necessary to obtain reproducible quantitative functional connectivity measurements needed for a reliable single-subject diagnostic test.

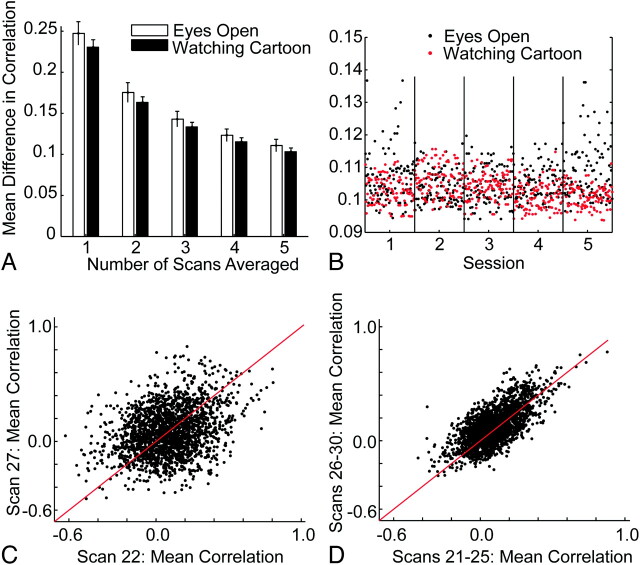
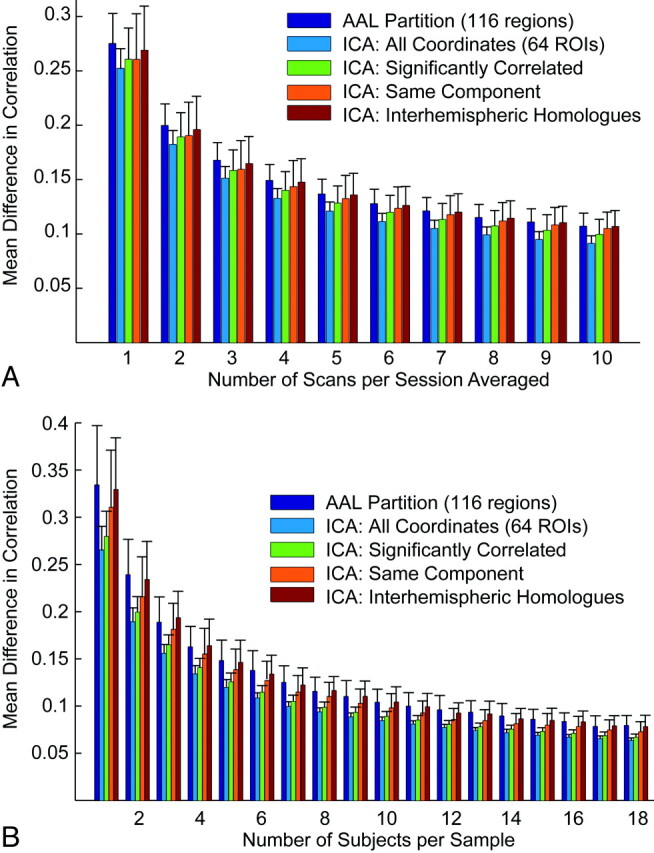
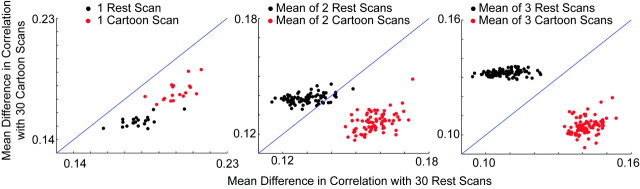
Materials and methods: We obtained 100 five-minute BOLD scans on a single subject, divided into 10 sessions of 10 scans each, with the subject at rest or while watching video clips of cartoons. These data were compared with resting-state BOLD scans from 36 healthy control subjects by evaluating the correlation between each pair of 64 small spheric regions of interest obtained from a published functional brain parcellation.

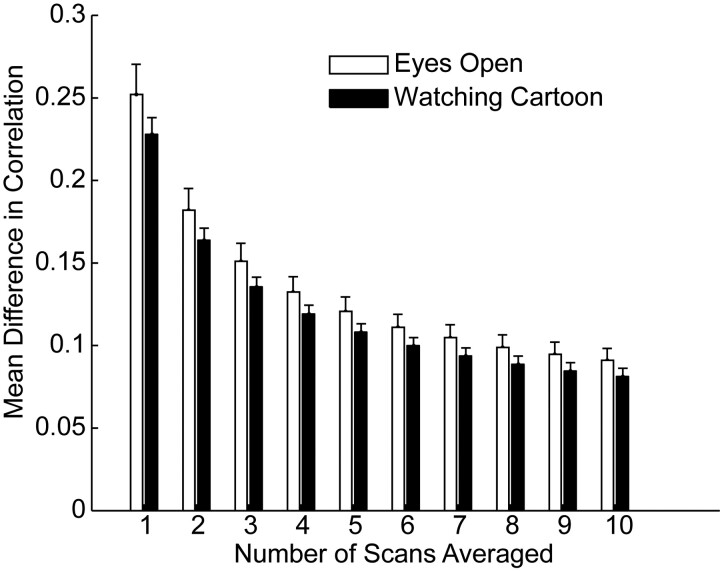
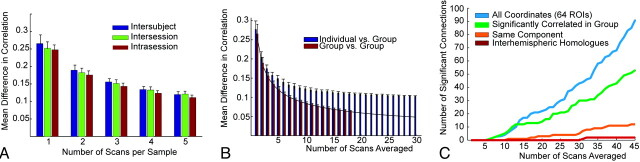
Results: Single-subject and group data converged to reliable estimates of individual and population connectivity values proportional to 1 / sqrt(n). Dramatic improvements in reliability were seen by using ≤25 minutes of imaging time, with smaller improvements for additional time. Functional connectivity "fingerprints" for the individual and population began diverging at approximately 15 minutes of imaging time, with increasing reliability even at 4 hours of imaging time. Twenty-five minutes of BOLD imaging time was required before any individual connections could reliably discriminate an individual from a group of healthy control subjects. A classifier discriminating scans during which our subject was resting or watching cartoons was 95% accurate at 10 minutes and 100% accurate at 15 minutes of imaging time.

Conclusions: An individual subject and control population converged to reliable different functional connectivity profiles that were task-modulated and could be discriminated with sufficient imaging time.


Figures

Fig 1.
Fig 1.
Intrasession reproducibility in 1 subject. A, Mean difference in Fisher-transformed correlations across 2016 pairs of 64 regions of interest between samples of scans obtained in the same session. Error bars show SDs across 100 groupings of ≤5 scans. B, Points show the mean difference in correlations for 100 samples of 5 scans compared with the remaining 5 scans within each of 5 sessions with the subject's eyes open but no stimuli and 5 sessions with the subject watching cartoons. C, Difference in correlations for 2016 pairs of 64 regions for 2 resting (eyes open) scans. D, Difference in correlations for 2 sets of 5 resting scans, averaged within each group and compared with each other in the scatterplot.
Fig 2.
Fig 2.
Intersession reproducibility. Mean difference in Fisher-transformed correlations across 2016 pairs of 64 regions of interest between samples of scans obtained in different sessions. Error bars show SDs across 100 groupings of ≤10 scans.
Fig 3.
Fig 3.
Intersubject reproducibility. A, Mean difference in Fisher-transformed correlations across 2016 pairs of 64 regions of interest between samples of scans obtained in different subjects. The curve showing 0.25 / sqrt(n) is superimposed. Error bars represent SDs across groups of subjects. B, Difference in correlation for 2016 pairs of 64 regions for 2 groups of 20 resting (eyes open) scans. C, Difference in correlation for 36 scans from different subjects by using 5 minutes of imaging data, compared with 50 resting scans from 1 subject.
Fig 4.
Fig 4.
Effect of region-of-interest choice on reproducibility. A, Mean difference in correlation for pairs of regions of interest defined by the AAL atlas and different subsets of the 64 coordinates chosen for the analysis within resting-state scans from a single individual (intersession). Error bars show SDs across 100 groups of scans. B, Mean differences in correlations for the same pairs of regions of interest for group results. Error bars show SDs across 100 groups of subjects for each number of scans averaged.
Fig 5.
Fig 5.
Imaging time required to distinguish an individual's functional connectivity fingerprint from the population. A, Interindividual, intersession, and intrasession reproducibility shows only small differences and similar improvements with more imaging time used to construct measurements. B, Mean differences in correlations within the group and between the individual and the group with increased number of scans averaged. The black line shows α / sqrt(n) to project expected reproducibility if increasing numbers of group subjects are used. The individual and group values diverge with increased imaging time. C, Number of individual pairs of regions of interest, which are significantly different between the individual and the group over 95% of n resting scan samples selected from the individual's results.
Fig 6.
Fig 6.
Performance of a task classifier (rest versus watching cartoons) with increased imaging time. Each point represents 1 sample of 1, 2, or 3 of the 20 resting or cartoon test scans compared with resting and cartoon standards obtained by averaging the first 30 scans of each type.

References

    1. Biswal B, Yetkin FZ, Haughton VM, et al. . Functional connectivity in the motor cortex of resting human brain using echo-planar MRI. Magn Reson Med 1995;34:537–41 - PubMed
    1. Fox MD, Raichle ME. Spontaneous fluctuations in brain activity observed with functional magnetic resonance imaging. Nat Rev Neurosci 2007;8:700–11 - PubMed
    1. Biswal BB, Mennes M, Zuo XN, et al. . Toward discovery science of human brain function. Proc Natl Acad Sci U S A 2010;107:4734–39 - PMC - PubMed
    1. Van Dijk KR, Hedden T, Venkataraman A, et al. . Intrinsic functional connectivity as a tool for human connectomics: theory, properties, and optimization. J Neurophysiol 2010;103:297–321. Epub 2009 Nov 4 - PMC - PubMed
    1. Greicius MD, Srivastava G, Reiss AL, et al. . Default-mode network activity distinguishes Alzheimer's disease from healthy aging: evidence from functional MRI. Proc Natl Acad Sci U S A 2004;101:4637–42 - PMC - PubMed

Publication types