

Questionnaire predictors of atopy in a US population sample: findings from the National Health and Nutrition Examination Survey, 2005-2006
- PMID: 21273397
- PMCID: PMC3105435
- DOI: 10.1093/aje/kwq392
Questionnaire predictors of atopy in a US population sample: findings from the National Health and Nutrition Examination Survey, 2005-2006
Abstract
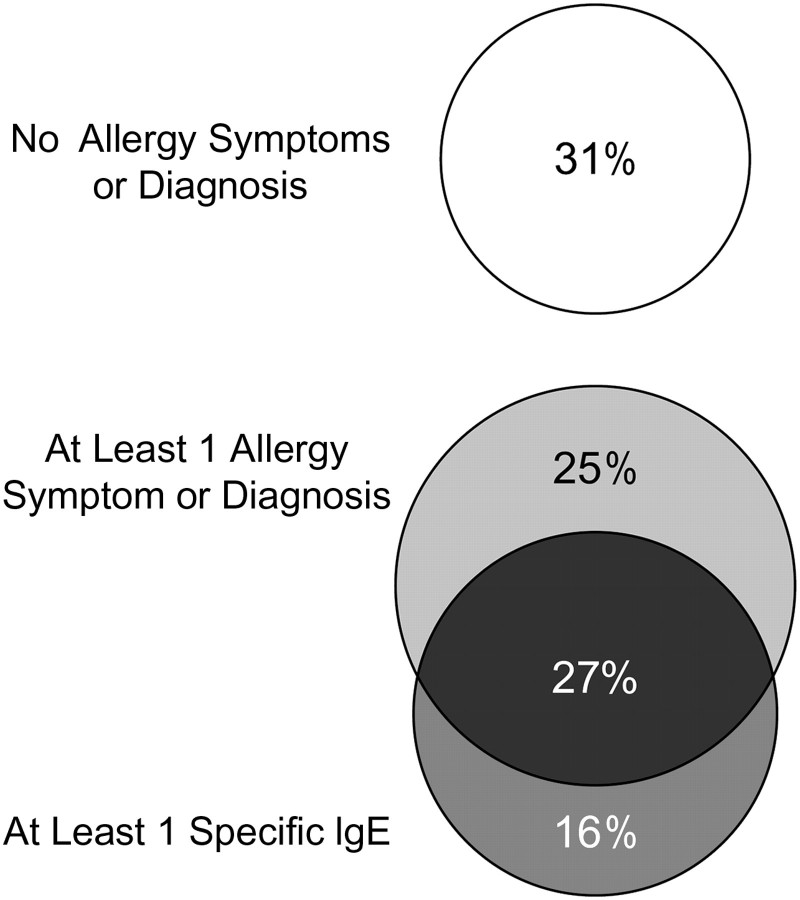
Allergic conditions and biochemical measures are both used to characterize atopy. To assess questionnaires' ability to predict biochemical measures of atopy, the authors used data on 5 allergic conditions (allergy, hay fever, eczema, rhinitis, and itchy rash) and serum-specific immunoglobulin E (IgE) levels from the 2005-2006 National Health and Nutrition Examination Survey. Atopy was defined as 1 or more positive specific IgEs (≥0.35 kU/L). Questionnaire responses were assessed for sensitivity, specificity, and positive and negative predictive values for atopy. In this population-based US sample, 44% of participants were specific IgE-positive and 53% reported at least 1 allergic condition. Discordance between atopy and allergic conditions was considerable; 37% of persons with atopy reported no allergic condition, and 48% of persons who reported an allergic condition were not atopic. Thus, no combination of self-reported allergic conditions achieved both high sensitivity and high specificity for IgE. The positive predictive value of reported allergic conditions for atopy ranged from 50% for eczema to 72% for hay fever, while the negative predictive value ranged from 57% for eczema to 65% for any condition. Given the high proportion of asymptomatic participants who were specific IgE-positive and persons who reported allergic conditions but were specific IgE-negative, it is unlikely that questionnaires will ever capture the same participants as those found to be atopic by biochemical measures.
Figures
References
-
- Rorke S, Holgate ST. The atopy phenotype revisited [in French] Rev Franc Allergol. 2004;44(5):436–444.
-
- Weinmayr G, Genuneit J, Nagel G, et al. International variations in associations of allergic markers and diseases in children: ISAAC phase two. Allergy. 2010;65(6):766–775. - PubMed
-
- Johansson SG, Hourihane JO, Bousquet J, et al. A revised nomenclature for allergy. An EAACI position statement from the EAACI nomenclature task force. Allergy. 2001;56(9):813–824. - PubMed
-
- Burney P, Malmberg E, Chinn S, et al. The distribution of total and specific serum IgE in the European Community Respiratory Health Survey. J Allergy Clin Immunol. 1997;99(3):314–322. - PubMed
-
- Eduard W, Omenaas E, Bakke PS, et al. Atopic and non-atopic asthma in a farming and a general population. Am J Ind Med. 2004;46(4):396–399. - PubMed
Publication types
MeSH terms
Substances
Grants and funding
LinkOut - more resources
Full Text Sources
Medical
