. 2011 Jan 26;31(4):1170-82.
doi: 10.1523/JNEUROSCI.3539-10.2011.

Differential electrophysiological changes in striatal output neurons in Huntington's disease

Affiliations

Differential electrophysiological changes in striatal output neurons in Huntington's disease

Véronique M André et al. J Neurosci. .

Abstract

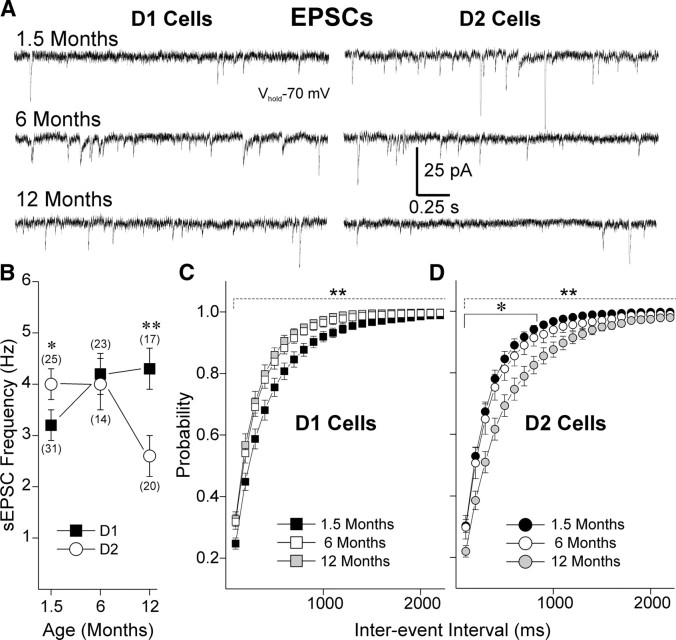
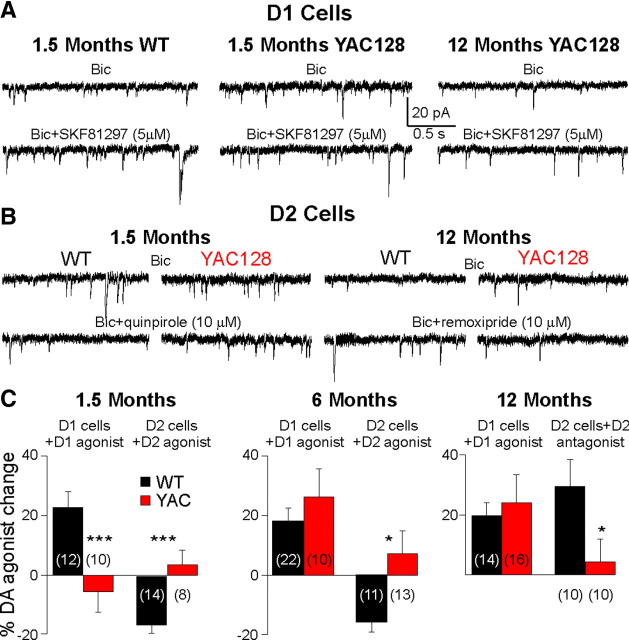
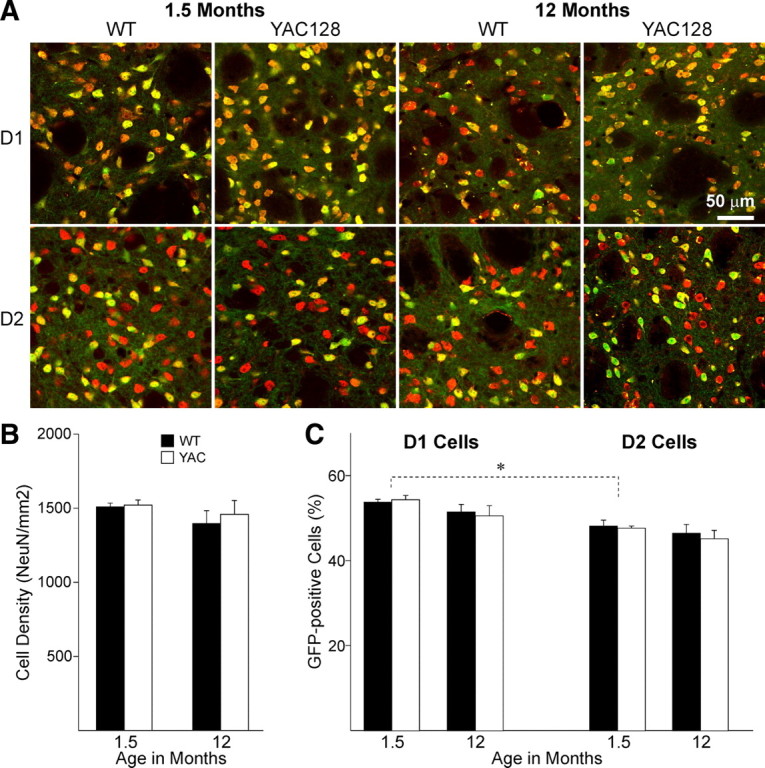
There is considerable evidence that alterations in striatal medium-sized spiny neurons (MSSNs) giving rise to the direct (D1 receptor-expressing) and indirect (D2 receptor-expressing) pathways differentially contribute to the phenotype of Huntington's disease (HD). To determine how each subpopulation of MSSN is functionally affected, we examined spontaneous excitatory postsynaptic currents (sEPSCs) and dopamine (DA) modulation in two HD mouse models, the YAC128 and the BACHD (a bacterial-artificial chromosome). These mice also expressed enhanced green fluorescent protein (EGFP) under the control of the promoter for either DA D1 or D2 receptors to identify neurons. In early symptomatic YAC128 and BACHD mice, glutamate transmission was increased in both D1 and D2 MSSNs, but in different ways. D1 cells displayed increased sEPSC frequencies and decreased paired-pulse ratios (PPRs) while D2 cells displayed larger evoked glutamate currents but no change in sEPSC frequencies or PPRs. D1 receptor modulation of sEPSCs was absent in D1-YAC128 cells at the early symptomatic stage but was restored by treating the slices with tetrabenazine. In contrast, in fully symptomatic YAC128 mice, glutamate transmission was decreased specifically in D1 cells, and D1 receptor modulation was normal in D1-YAC128 cells. Behaviorally, early symptomatic mice showed increased stereotypies that were decreased by tetrabenazine treatment. Together, these studies support differential imbalances in glutamate and DA transmission in direct and indirect pathway MSSNs. Stereotypic behavior at an early stage could be explained by increased glutamate activity and DA tone in direct pathway neurons, whereas hypokinesia at later stages could result from reduced input onto these neurons.


Figures

Figure 1.
Figure 1.
Frequency of sEPSCs varies differentially with age in D1 and D2 cells in WTs. A, Traces show sEPSCs in D1- and D2-WT cells at 1.5, 6, and 12 months. B, Graph shows that the mean frequency of sEPSCs increases with age in D1 while it decreases with age in D2 cells. At 1.5 months, sEPSC frequency was significantly higher in D2 cells, whereas at 12 months, it was significantly higher in D1 cells. C, Cumulative probability distributions of interevent intervals in D1-WT cells show that intervals significantly decrease at 6 and 12 months compared with 1.5 months. D, Cumulative probability distributions of interevent intervals in D2-WT cells show that intervals significantly increase at 12 months compared with 1.5 and 6 months. Numbers of cells per group in parentheses. *p < 0.05 and **p < 0.01 in this and other figures.
Figure 2.
Figure 2.
Biphasic alterations of excitatory synaptic transmission in D1-YAC128 cells. A, Mean sEPSC frequency and cumulative probability distributions of interevent interval histograms for sEPSCs show that D1-YAC128 cells display higher sEPSC frequencies at 1.5 months, while at 12 months D1-YAC128 cells display lower sEPSC frequencies. B, Mean mEPSC frequency (inset) and cumulative probability distribution of interevent intervals for mEPSCs at 1.5 months show that D1-YAC128 cells display a significantly higher mEPSC frequency. C, PPRs were significantly decreased in D1-YAC128 cells at 1.5 months, indicating increased glutamate release probability. In contrast, PPRs were increased in D1-YAC128 cells at 12 months, indicating decreased probability of glutamate release.
Figure 3.
Figure 3.
Excitatory synaptic transmission in D2-YAC128 cells. A, Mean sEPSC frequency was not different in D2-YAC128 and D2-WT cells at any age. Cumulative probability distributions of interevent intervals only showed slight differences at 12 months when D2-YAC128 cells displayed significantly fewer sEPSCs, at the longer intervals only. B, Mean mEPSC frequency (inset) and cumulative probability distribution of interevent intervals for mEPSCs were not different at 1.5 months for D2-YAC128 and D2-WT cells. C, PPRs were not different in D2-YAC128 cells compared with D2-WT cells at each age tested.
Figure 4.
Figure 4.
Mean amplitude of evoked EPSCs is increased in D2-YAC128 cells at 1.5 months and decreased at 12 months in D1-YAC128 cells. A, Traces show evoked EPSCs in WT (black) and YAC128 (red) at 1.5 and 12 months. Numbers above traces are stimulus intensities. B, Input–output functions show evoked EPSCs at the two ages in WT cells. Currents increase significantly with age in D1 cells but show no change in D2 cells. C, At 1.5 months, evoked EPSC amplitudes are similar in D1-YAC128 compared with D1-WT cells, whereas at 12 months, evoked EPSC amplitudes are decreased in D1-YAC128 cells compared with D1-WT cells. D, At 1.5 months, evoked EPSC amplitudes are increased in D2-YAC128 compared with D2-WT cells while at 12 months, they are similar.
Figure 5.
Figure 5.
Evoked EPSCs and PPRs in BACHD mice at 2 months. A, PPRs are significantly decreased in D1-BACHD compared with D1-WT cells at 2 months. In contrast, PPRs are similar in D2-BACHD and D2-WT cells. B, Evoked EPSC amplitudes are significantly increased in D2-BACHD compared with D2-WT cells, whereas they are similar in D1-BACHD and D1-WT cells.
Figure 6.
Figure 6.
DA modulation of sEPSCs in D1 and D2 cells is altered in YAC128 mice. A, Traces show that at 1.5 months, the D1 receptor agonist SKF81297 increased sEPSC frequency in D1-WT cells, whereas it had no effect in D1-YAC128 cells. In contrast, at 12 months, SKF81297 increased the frequency of sEPSCs. B, Traces show that at 1.5 months, the D2 receptor agonist quinpirole decreases sEPSCs in D2-WT cells but not in D2-YAC128 cells. At 12 months, the D2 receptor antagonist remoxipride increases sEPSC frequency in D2-WT cells but not in D2-YAC128 cells. C, Bar graphs show the percentage changes in sEPSC frequency in D1 and D2 cells in WT and YAC128 mice at three ages.
Figure 7.
Figure 7.
A, Effect of TBZ on sEPSC frequency in D1-WT and D1-YAC128 cells at 1.5 months. In D1-WT cells, TBZ induced a transient but significant increase in sEPSC frequency at 5 min while at 40, 50, and 65 min, TBZ induced a significant decrease in sEPSC frequency. In D1-YAC128 cells, TBZ did not increase sEPSC frequency but induced a larger decrease than in D1-WT cells at 25, 40, 50, and 65 min. B, In YAC128 slices (1.5 months) incubated for 2–4 h in TBZ, the D1 receptor agonist SKF81297 (5 μm) induced a significant increase in frequency of sEPSCs in D1 cells while in YAC128 incubated in DMSO, SKF81297 had no effect. The effect of SKF81297 was significantly different between DMSO and TBZ treatment. C, In 2-month-old BACHD mice, in TBZ-incubated slices, D1 cells showed PPRs higher than those in DMSO-incubated slices, similar to PPRs in D1-WT cells. D, Traces and graphs show that sEPSC frequency is higher in D1-BACHD cells (2 months) than in D1-WT cells. In addition, the D1 agonist SKF81297 increased sEPSC frequency in D1-WT cells but not in D1-BACHD cells. E, Amplitude–frequency histogram shows that in D1-WT cells, the D1 antagonist SCH23390 (20 μm) had no effect on sEPSC frequency. F, In contrast, in D1-BACHD cells, the D1 antagonist decreased sEPSC frequency. Inset shows that the percentage change induced by SCH23390 is significantly different in D1-WT and D1-BACHD cells. *p < 0.05, **p < 0.01, ***p < 0.001, effect of TBZ compared with control (0 min in TBZ). # p < 0.05 and ### p < 0.001 in D1-YAC128 (or D1-BACHD) compared with D1-WT cells. *p < 0.05 in TBZ-treated vs DMSO-treated slices.
Figure 8.
Figure 8.
Locomotor activity in YAC128 and BACHD mice. A, YAC128 mice at 6 and 12 months displayed decreased distance traveled during 15 min in the open-field apparatus compared with WT mice. In WT and YAC128 mice, the distance traveled slightly decreased with age. In WT mice at 12 months, distance traveled was lower than that at 1.5 and 6 months. In YAC128 mice, distance was significantly decreased at 12 compared with 6 months. B, YAC128 mice at 1.5 and 6 months old showed more stereotypies than WT mice, whereas at 12 months, stereotypies were similar in WT and YAC128 mice. The number of stereotypic movements decreased with age in YAC128 mice. C, In 2-month-old BACHD mice, distance traveled was significantly lower than in the WT mice. D–F, BACHD mice display more stereotypies (D), more grooming (E), and more sniffing (F) than WT mice. G, TBZ (2.5 mg/kg) decreased distance traveled during 15 min in the open-field apparatus in 2-month-old WT and BACHD mice, and the percentage decrease was similar in WT and BACHD mice. H, TBZ did not have any effect on stereotypies in WT mice, while it decreased them in BACHD mice. *p < 0.05 and **p < 0.01 in YAC128 (or BACHD) compared with WT mice at each age. # p < 0.05 in WT mice at different ages. § p < 0.05 in YAC128 mice at different ages. p < 0.05 before and after TBZ treatment.
Figure 9.
Figure 9.
A, Photomicrographs of immunofluorescent staining for NeuN (red) combined with EGFP in D1 (top row) or D2 cells (bottom row), at 1.5 (2 left columns) and 12 (2 right columns) months in the dorsal striatum of WT and YAC128 mice. Pictures show overlay of EGFP and NeuN, in which cells expressing both appear yellow. B, Bar graph of neuronal (NeuN) densities at both ages do not show any differences between WT and YAC128 mice. C, Bar graph shows that the ratio of EGFP-positive neurons does not change between WT and YAC128 mice at any age. There are more D1-EGFP-positive than D2-EGFP-positive neurons at 1.5 months. *p < 0.05 between D1- and D2-EGFP neurons.

References

    1. Albin RL, Reiner A, Anderson KD, Dure LS, 4th, Handelin B, Balfour R, Whetsell WO, Jr, Penney JB, Young AB. Preferential loss of striato-external pallidal projection neurons in presymptomatic Huntington's disease. Ann Neurol. 1992;31:425–430. - PubMed
    1. André VM, Cepeda C, Cummings DM, Jocoy EL, Fisher YE, William Yang X, Levine MS. Dopamine modulation of excitatory currents in the striatum is dictated by the expression of D1 or D2 receptors and modified by endocannabinoids. Eur J Neurosci. 2010;31:14–28. - PubMed
    1. Antoniou K, Kafetzopoulos E, Papadopoulou-Daifoti Z, Hyphantis T, Marselos M. D-amphetamine, cocaine and caffeine: a comparative study of acute effects on locomotor activity and behavioural patterns in rats. Neurosci Biobehav Rev. 1998;23:189–196. - PubMed
    1. Benn CL, Slow EJ, Farrell LA, Graham R, Deng Y, Hayden MR, Cha JH. Glutamate receptor abnormalities in the YAC128 transgenic mouse model of Huntington's disease. Neuroscience. 2007;147:354–372. - PMC - PubMed
    1. Bertran-Gonzalez J, Bosch C, Maroteaux M, Matamales M, Hervé D, Valjent E, Girault JA. Opposing patterns of signaling activation in dopamine D1 and D2 receptor-expressing striatal neurons in response to cocaine and haloperidol. J Neurosci. 2008;28:5671–5685. - PMC - PubMed

Publication types

MeSH terms