. 2011 Jan 26;31(4):1193-203.
doi: 10.1523/JNEUROSCI.1379-10.2011.

Theta-burst transcranial magnetic stimulation alters cortical inhibition

Affiliations

Theta-burst transcranial magnetic stimulation alters cortical inhibition

Alia Benali et al. J Neurosci. .

Abstract

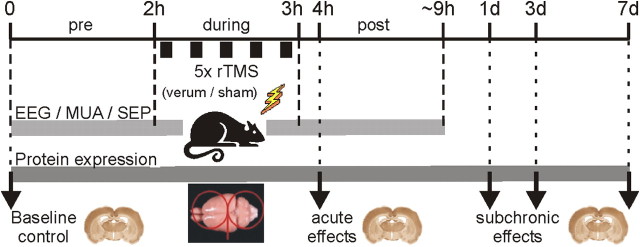
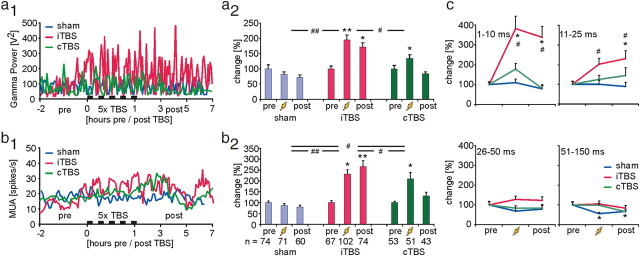
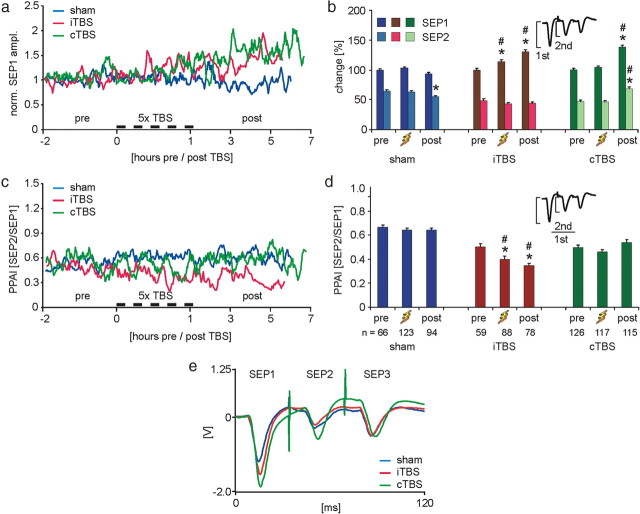
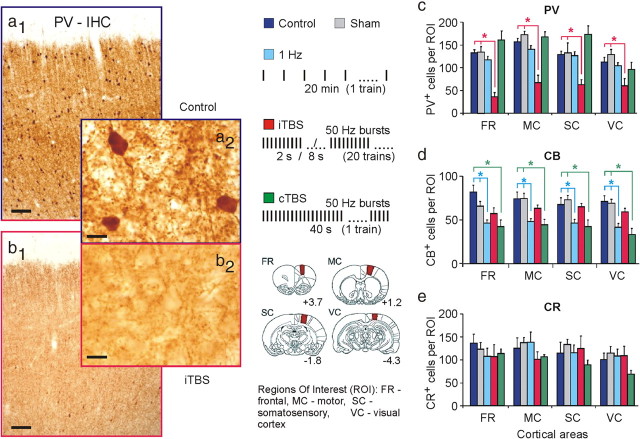
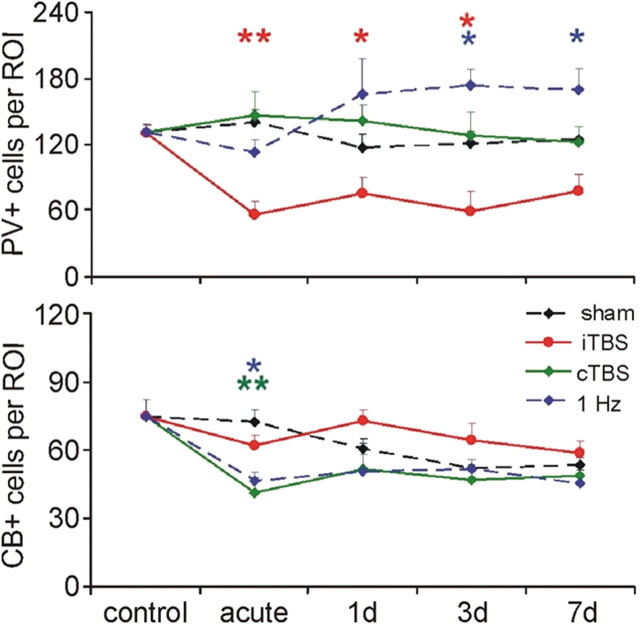
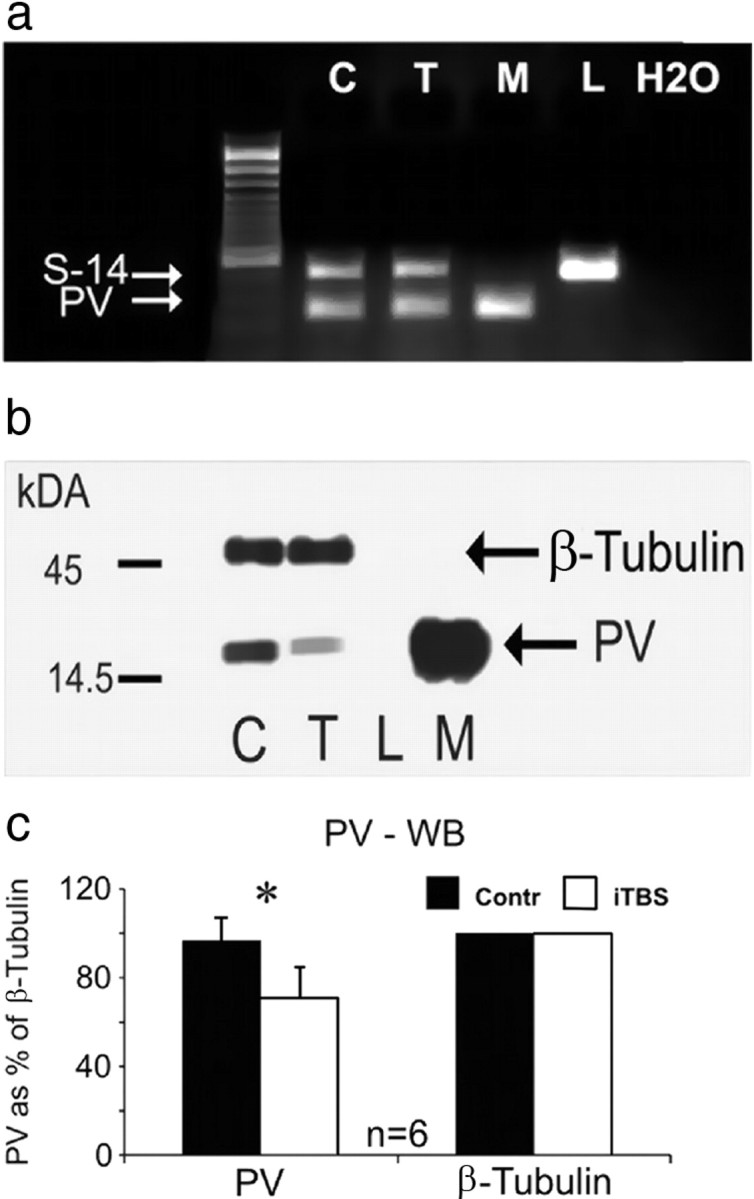
Human cortical excitability can be modified by repetitive transcranial magnetic stimulation (rTMS), but the cellular mechanisms are largely unknown. Here, we show that the pattern of delivery of theta-burst stimulation (TBS) (continuous versus intermittent) differently modifies electric activity and protein expression in the rat neocortex. Intermittent TBS (iTBS), but not continuous TBS (cTBS), enhanced spontaneous neuronal firing and EEG gamma band power. Sensory evoked cortical inhibition increased only after iTBS, although both TBS protocols increased the first sensory response arising from the resting cortical state. Changes in the cortical expression of the calcium-binding proteins parvalbumin (PV) and calbindin D-28k (CB) indicate that changes in spontaneous and evoked cortical activity following rTMS are in part related to altered activity of inhibitory systems. By reducing PV expression in the fast-spiking interneurons, iTBS primarily affected the inhibitory control of pyramidal cell output activity, while cTBS, by reducing CB expression, more likely affected the dendritic integration of synaptic inputs controlled by other classes of inhibitory interneurons. Calretinin, the third major calcium-binding protein expressed by another class of interneurons was not affected at all. We conclude that different patterns of TBS modulate the activity of inhibitory cell classes differently, probably depending on the synaptic connectivity and the preferred discharge pattern of these inhibitory neurons.


Figures

Figure 1.
Figure 1.
Timeline of the two major series of rTMS experiments. In one electrophysiological series, EEG activity, MUA, and SEP activity was recorded before (pre), during, and up to ∼6 h post-rTMS, with either verum or sham iTBS or cTBS applied to the rats. In case of the molecular-biological/histological series, four different time points following rTMS were investigated: 2 h (acute), and 1, 3, and 7 d (subchronic) post-rTMS, with groups receiving either verum 1 Hz rTMS, iTBS, or cTBS, or sham rTMS for each time point. In addition, a baseline control group receiving no rTMS at all was studied (17 groups in total). The red figure-of-eight symbol on top of the isolated rat brain shown in the bottom figure indicates the center position and orientation of the coil. Note: the coil is much bigger than shown in the drawing and windings in the center at the contact point of both coils cover the entire brain.
Figure 2.
Figure 2.
rTMS-induced changes in spontaneous MUA and EEG gamma-power. a1, Time course of changes in the gamma-power of the EEG for the two groups of experimental animals receiving either iTBS or cTBS (5 times at 15 min intervals) and a control group receiving sham-TBS (4 rats per group). Individual measurements were temporally aligned to the onset of the first TBS application (time = 0). a2, Mean and SEM of gamma-power during the three measurement episodes [pre, during (zigzag symbol), post] and for the three experimental groups. For each group, data are normalized, dividing them by the mean of the data points of the pre-TBS condition. b1, b2, Time course and statistics for mean spontaneous MUA rate. Different from gamma-power, temporal change in MUA rate (b1) is smoothed by a sliding mean build by averaging 7 consecutive data points. c, Relative changes in the interspike interval distribution within ranges of 1–10, 11–25, 26–50, and 50–150 ms, corresponding to 100 Hz and higher, 40–100 Hz, 20–40 Hz, and <20 Hz, respectively. *p < 0.05, **p < 0.01 (Tukey's post hoc test), significant difference from pre condition within each group; #p < 0.05, ##p < 0.01 (ANOVA), significant differences between groups.
Figure 3.
Figure 3.
rTMS effects on evoked sensory activity. a, Time course of changes in the amplitude of the first SEP (SEP1, electrical stimulation) in a series of three subsequent stimulations. For each group, data are normalized, dividing them by the mean of the data points of the pre-TBS condition. For details on time axis, see legend of Figure 2. b, Mean amplitudes and SEM for the first (SEP1) and second (SEP2) evoked response normalized to the pre-TBS conditions. c, Temporal change of the PPAI calculated as the ratio of second to first response (SEP2/SEP1) for the three experimental groups. d, Means and SEM of PPAI. *p < 0.05 (Tukey's post hoc test) significant difference from pre condition within each group; #p < 0.05 (ANOVA/Tukey), significant differences of same condition between groups. e, Averaged SEP traces for post condition of the three experimental groups (not normalized).
Figure 4.
Figure 4.
Acute changes in CaBP expression following rTMS. PV expression was strongly reduced ∼2 h after verum iTBS, while CB expression was reduced following cTBS and 1 Hz rTMS. a1, a2, Coronal sections through the frontal cortex of a control rat showing basal expression of PV. b1, b2, Same cortical region in a rat treated with iTBS. DAB staining. Scale bar: (a1, b1), 100 μm; (a2, b2), 10 μm. c–e, Statistics (means and SEM) of the number of cells expressing PV, CB, and CR in different cortical regions (ROI) (see legend inset) for a baseline control group, a sham-rTMS group, and groups treated with either 1 Hz rTMS, or iTBS or cTBS (n = 6–8 in each group). *p < 0.05 (Tukey's post hoc test). Inset legend in the middle panel shows the rTMS protocols used (top) and ROIs analyzed for stained neurons (bottom). Areas filled in red in the drawings of rat brain frontal sections correspond to ROI. Related numbers indicate anterior (+) to posterior (−) level relative to bregma in millimeters according to Paxinos and Watson (1986). See supplemental Figure S3, available at www.jneurosci.org as supplemental material, for further details.
Figure 5.
Figure 5.
Time course of rTMS-induced changes in PV and CB expression. Acute (2 h) and subchronic (1–7 d) changes in the number of the cortical cells expressing PV (top) or CB (bottom) following iTBS, cTBS, 1 Hz rTMS and sham stimulation. *p < 0.05, **p < 0.01 tested with ANOVA (factors: time and experimental condition) and post hoc Tukey test. Each data point represents the mean of 3–4 animals and averaged data of all ROIs (see supplemental Fig. S4, available at www.jneurosci.org as supplemental material, for data of individual ROIs).
Figure 6.
Figure 6.
Quantification of PV mRNA and protein. a, Quantification of PV-mRNA using RT-PCR for tissue probes obtained from the frontal cortex of control rats (C) and iTBS-treated rats (T, acute group), as well as reference tissue probes of muscle (M) and liver (L). No quantitative difference in the amount of the PCR-amplicon resembling PV-mRNA is evident between controls and iTBS-treated animals. Housekeeping gene S14 was taken for reference and a 100 base pair DNA ladder is shown to the left. A pure water reference (H2O) is added to the right. b, Western blot (WB) showing a smaller amount of PV protein in frontal cortex of animals treated with iTBS (T) compared with controls (C). For reference, tissue probes of liver (L, no PV expression) and muscle (M, large amounts of PV) are shown. The expression of the cytoskeleton-related protein β-tubulin is not affected. c, WB reveals significantly reduced tissue content of PV in iTBS-rTMS-treated rats compared with controls (*p < 0.05, unpaired Wilcoxon test).
Figure 7.
Figure 7.
Colabeling of PV with Kv3.1b or WFA. a1–a3, Coronal sections through the frontal cortex of a rat treated with iTBS. Immunofluorescence labeling of PV (green) and Kv3.1b (red) are combined. Note that supragranular layers almost completely lost PV expression while Kv3.1b is still expressed in many cells. b1, b2, Following iTBS (b2), PV cells still exist, as indicated by lectin staining of perineuronal nets (WFA, green), while concomitant immunolabeling (red) reveals the loss of PV phenotype, compared with controls (b1).
Figure 8.
Figure 8.
Immunelectron microscopic analysis of PV-positive interneurons and WFA-stained perineuronal nets. PV (a1–5) and perineuronal net (WFA) (b1,2) immunoperoxidase labeling of the motor cortex in iTBS-treated rat brain (acute, 2 h). Toluidine blue-stained 0.8-μm-thick semithin section of an area with reduced PV expression shows no signs of cell death (a1,2). Adjacent semithin section (a3) displays single PV-positive neurons with faint (arrows) and strong (arrowheads) immunoreactivity. Electron microscopy exhibits PV-positive interneurons, both with strong (a4) and weak (a5) PV immunoreactivity. Integrity of such interneurons is further confirmed by frequently surrounding WFA-positive perineuronal nets detected in toluidine blue-counterstained semithin (b1) and corresponding ultrathin sections (b2).

References

    1. Allen EA, Pasley BN, Duong T, Freeman RD. Transcranial magnetic stimulation elicits coupled neural and hemodynamic consequences. Science. 2007;317:1918–1921. - PubMed
    1. Allison T. Recovery functions of somatosensory evoked responses in man. Electroencephalogr Clin Neurophysiol. 1962;14:331–343. - PubMed
    1. Aydin-Abidin S, Trippe J, Funke K, Eysel UT, Benali A. High- and low-frequency repetitive transcranial magnetic stimulation differentially activates c-fos and zif268 protein expression in the rat brain. Exp Brain Res. 2008;188:249–261. - PubMed
    1. Baumgärtel K, Tweedie-Cullen RY, Grossmann J, Gehrig P, Livingstone-Zatchej M, Mansuy IM. Changes in the proteome after neuronal zif268 overexpression. J Proteome Res. 2009;8:3298–3316. - PubMed
    1. Beaulieu C. Numerical data on neocortical neurons in adult rat, with special reference to the GABA population. Brain Res. 1993;609:284–292. - PubMed

Publication types

LinkOut - more resources