. 2011 Jan 26;31(4):1267-78.
doi: 10.1523/JNEUROSCI.4545-10.2011.

The mouse cochlea expresses a local hypothalamic-pituitary-adrenal equivalent signaling system and requires corticotropin-releasing factor receptor 1 to establish normal hair cell innervation and cochlear sensitivity

Affiliations

The mouse cochlea expresses a local hypothalamic-pituitary-adrenal equivalent signaling system and requires corticotropin-releasing factor receptor 1 to establish normal hair cell innervation and cochlear sensitivity

Christine E Graham et al. J Neurosci. .

Abstract

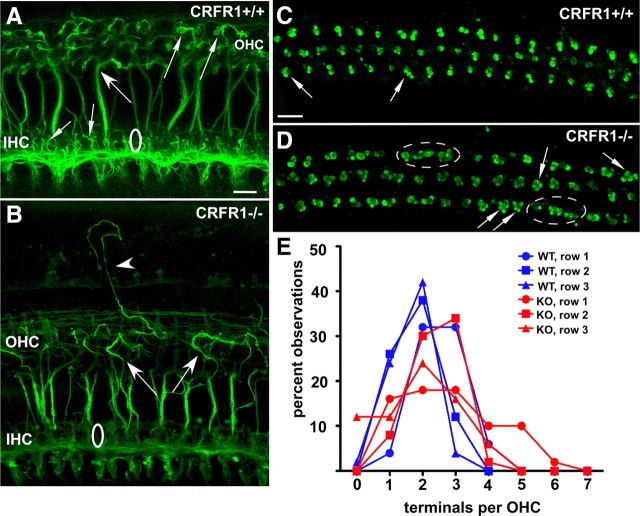
Cells of the inner ear face constant metabolic and structural stress. Exposure to intense sound or certain drugs destroys cochlea hair cells, which in mammals do not regenerate. Thus, an endogenous stress response system may exist within the cochlea to protect it from everyday stressors. We recently described the existence of corticotropin-releasing factor (CRF) in the mouse cochlea. The CRF receptor type 1 (CRFR1) is considered the primary and canonical target of CRF signaling, and systemically it plays an essential role in coordinating the body-wide stress response via activation of the hypothalamic-pituitary-adrenal (HPA) axis. Here, we describe an essential role for CRFR1 in auditory system development and function, and offer the first description of a complete HPA equivalent signaling system resident within the cochlea. To reveal the role of CRFR1 activation in the cochlea, we have used mice carrying a null ablation of the CRFR1 gene. CRFR1(-/-) mice exhibited elevated auditory thresholds at all frequencies tested, indicating reduced sensitivity. Furthermore, our results suggest that CRFR1 has a developmental role affecting inner hair cell morphology and afferent and efferent synapse distribution. Given the role of HPA signaling in maintaining local homeostasis in other tissues, the presence of a cochlear HPA signaling system suggests important roles for CRFR1 activity in setting cochlear sensitivity, perhaps both neural and non-neural mechanisms. These data highlight the complex pleiotropic mechanisms modulated by CRFR1 signaling in the cochlea.


Figures

Figure 1.
Figure 1.
CRFR1 expression overlaps and juxtaposes sites of CRF expression suggesting paracrine and juxtacrine signaling. A, Immunofluorescent detection of GFP driven by the CRFR1 promoter demonstrates expression in the inner sulcus (IS) and support cells lateral to the organ of Corti (OC). Intense immunoreactivity is also observed in the organ of Corti (boxed), shown at higher magnification in C. B, Double label with CRF reveals regions of overlapping expression (inner sulcus and lateral support cells), suggesting the possibility of paracrine/autocrine signaling. C, At higher magnification, intense CRFR1-GFP immunofluorescence is observed in the Deiters' cells and in the border cell (BC). D, Overlay with CRF reveals that these CRFR1-positive cells juxtapose cells expressing CRF, including the IHCs and OHCs (arrows). TM, Tectorial membrane; SGN, spiral ganglion neurons; SpLim, spiral limbus; OS, outer sulcus; SpLig, spiral ligament; RM, Reissner's membrane; ToC, tunnel of Corti. Scale bars: C, 60 μm; D, 10 μm.
Figure 2.
Figure 2.
The cochlea expresses an HPA-equivalent signaling system. Immunofluorescent labeling of POMC, ACTH, and MC2R reveals expression of classic HPA components in the cochlea. A, D, G, POMC and ACTH are expressed in inner and outer sulcus cells lining the cochlear duct (IS and OS, respectively). MC2 is expressed in these regions to a lesser extent (C). All components are expressed in the spiral ganglion cells (SG). The organ of Corti region is boxed in A and is the region from which the higher magnification illustrations were produced. B, C, Higher magnification of the organ of Corti region reveals intense POMC labeling in the Deiters' cells (DCs) (B), and this expression overlaps with CRFR1-GFP label (C). E, F, ACTH shows less immunolabeling in Deiters' cells compared with POMC, but an intense labeling of the IHC. H, I, Finally, in the organ of Corti region, MC2R shows an intense and specific labeling for the IHC and a lack of Deiters' cell labeling. Scale bars: A (for A, D, G), 60 μm; B (for B, C, E, F, H, I), 10 μm. HC, Hensen's cell. CRFR1 designates CRFR1-GFP immunolabeling.
Figure 3.
Figure 3.
Elimination of CRFR1 causes auditory impairment. A, ABR thresholds were measured in wild-type and CRFR1−/− mice. Symbols mark the average threshold observed at each frequency tested (5.66, 8, 16, 22.65, 32, 45.25 kHz) ± SEM. CRFR1−/− mice exhibited a 20–30 dB increase in ABR thresholds. B, The amplitude versus sound level relationship of the 22 kHz wave 1 obtained during ABR analysis was plotted. The loss of sensitivity of CRFR1−/− mice is reflected in the pronounced zero amplitude up to 45 dB stimulus intensity. Once the CRFR1−/− wave 1 response began to grow, however, the slope of the amplitude growth was identical, although the peak current was 35% less than that of the CRFR1+/+ mice (two-way ANOVA, F(1,122) = 66.49, p < 0.0001). C, Sound levels required to generate a 2f1–f2 DPOAE isoresponse to 0 dB was increased 5–10 dB in CRFR1−/− mice compared with wild-type mice. All error bars are SEM.
Figure 4.
Figure 4.
Threshold–threshold plots reveal dynamics of DP and ABR threshold changes induced by loss of CRFR1 expression. To better assess the origins of the ABR threshold shifts observed in CRFR1−/− mice, threshold–threshold differences (null threshold values subtracted from wild-type values) were plotted. DP amplitude differences are similar for each tested frequency, but ABR thresholds vary more widely, suggesting that a simple decline in EP and any consequent associated change in cochlear amplifier function cannot explain the entire ABR threshold shift observed. Thus, a mixed neural and EP deficit is indicated as cause for altered ABR thresholds in CRFR1−/− mice. Numbers next to symbols indicate frequency tested. WT, Wild-type.
Figure 5.
Figure 5.
GLAST expression is normal in CRFR1−/− mice, while glutamine synthetase levels are reduced in CRFR1−/− mice and rescued by corticosterone treatment. A, Western blot analysis of whole cochlear lysates revealed normal levels of GLAST expression in CRFR1−/− mice. B, Decreased expression of glutamine synthetase was observed in CRFR1−/− compared with wild-type mice (no treatment) or vehicle treatment (0.25% ethanol in double distilled H2O). Glucocorticoid replacement therapy via administration of 0.25 mg/ml corticosterone (dissolved in 0.25% ethanol) in the drinking water beginning either at P12 or in embryonic development rescued the glutamine synthetase deficiency in CRFR1−/− mice. C, To quantify the expression levels and effects of treatment, Western blot band densities were measured and normalized to lane loading controls. With no treatment, CRFR1−/− mice expressed ∼50% of the glutamine synthetase levels of CRFR1+/+ mice (*p = 0.0215), and vehicle control was similar to no treatment with respect to decreased glutamine synthetase expression (*p = 0.0289). However, corticosterone replacement therapy rescued the glutamine synthetase expression defect of CRFR1−/− mice, bringing the levels up to CRFR1+/+ values (p = 0.616). Despite a trend toward increased GLAST expression, baseline (no treatment) GLAST expression was not significantly different between CRFR1−/− and CRFR1+/+ mice (p = 0.3248). All error bars are SEM.
Figure 6.
Figure 6.
Corticosterone treatment does not rescue auditory function deficits in CRFR1−/− mice. Timed pregnant CRFR1−/− and wild-type mice (n = 6 per group) were administered corticosterone (0.25 mg/ml) in their drinking water begining at E12. Auditory function of the pups was analyzed at 8 weeks of age (with continuous corticosterone treatment after weaning). A, ABR thresholds remained elevated in CRFR1−/− mice (red line) compared with wild-type mice (blue line) by an average of 10–15 dB. Interestingly, the decrease in threshold difference compared with wild types is reflected not in a rescue of the CRFR1−/− ABR thresholds (compare with Fig. 3), but rather an elevation in the wild-type ABR thresholds. B, ABR suprathreshold responses following glucocorticoid administration from the same animals in A reveal that maximal amplitude response of CRFR1−/− mice is increased to normal levels, while that of wild types decreased to levels similar to that of nontreated CRFR1−/− mice (compare with Fig. 3B). All error bars are SEM.
Figure 7.
Figure 7.
CRFR1−/− mice possess normal numbers of afferent synapses but abnormal synapse distribution. A, Presynaptic ribbons and postsynaptic terminals were localized on the inner hair cell by double immunolabeling for CTBP2 (green), a maker for synaptic ribbons in hair cells, and GluR4 (red). While a coincident overlay of ribbons and GluR immunopositive puncta was present in both CRFR1+/+ and CRFR1−/− mice, GluR4 puncta appeared larger in CRFR1−/− mice. Additionally, GluR4 puncta were more often apposed to two CTBP2 (synaptic ribbon) puncta in the CRFR1−/− mice (arrows) compared with CRFR1+/+ mice. The distance between the nucleus and the edge of the synaptic zone (d) was shorter in CRFR1−/− mice compared with wild-type mice, generating a tighter clustering of GluR4/CTBP2 ensembles compared with wild-type mice. Scale bar, 5 μm. B, Three-dimensional reconstruction of the basal region of IHCs following double labeling for GluR4 (red) and CTBP2 (green). Large aggregations of GluR4 puncta (arrows) were present in CRFR1−/− mice that were only occasionally observed in wild-type mice. Space-filling reconstructions allowed better visualization of doubled ribbon structures (arrowheads) in CRFR1−/− mice. These were often discerned from simple large ribbons by contours representing the upper and lower limits of the individual ribbons in the aggregate. By contrast, very few double ribbons were observed in wild-type mice (e.g., A, arrow). Few GluR4/CTBP2 profiles were observed on the pillar side of the IHC nuclei in CRFR1−/− mice. C, Western blot of cochlear samples revealed a significant increase in GluR4 expression in CRFR1−/− mice compared with CRFR1+/+ mice (**p = 0.0074, error bars are SEM). D, Measurement of GluR4 puncta in the x–y-plane revealed a bimodal distribution of GluR4 puncta size in both CRFR1+/+ (blue) and CRFR1−/− (red) mice. CRFR1−/− mice possessed more puncta 0.6 μm2 and larger (upward shift of curve) and a statistically significant increase in mean puncta size (p = 0.0007). E, Three-dimensional analysis revealed an abnormal synaptic ribbon distribution in the CRFR1−/− mice (right), with more ribbons clustered toward the modiolar side of the hair cell in CRFR1−/− mice and fewer falling on the pillar side compared with wild type (right). WT, Wild-type; KO, knock-out.
Figure 8.
Figure 8.
Elimination of CRFR1 causes abnormal afferent fiber innervation. Afferent fibers and their most distal endings were visualized using antibodies directed against NKA (green). IHCs were immunolabeled using antibodies against myosin VI (red). A–D, Whole-mount sections of cochlear middle turns were imaged in CRFR1+/+ (A, B) and CRFR1−/− (C, D) mice. A, C, Significant differences in hair cell width [modiolar (m) to pillar (p) along the y-axis] are evident. B, D, Afferent fiber endings were found on all sides of the IHCs in CRFR1+/+ mice and were decorated with immunoreactive puncta that outlined the termination of the fibers (arrows). These fibers appeared stunted in CRFR1−/− mice, with few endings reaching toward the pillar side of the inner hair cell (above dashed line, arrows), and none exhibiting the immunoreactive puncta observed in B. E–G, An abnormal cluster of fibers was found on the modiolar side of the IHCs of CRFR1−/− mice (F, dashed box) that is not present in CRFR1+/+ mice (E). YZ projections highlight this abnormal clustering in CRFR1−/− mice (G, boxed region). H, I, YZ projections also revealed reduced innervation on the pillar surface of the IHC in CRFR1−/− mice (I) compared with CRFR1+/+ mice (H) (dashed ovals).
Figure 9.
Figure 9.
Elimination of CRFR1 causes abnormal efferent fiber innervation to OHCs. A, B, Efferent fibers were visualized with an antibody directed against TuJ1. Olivocochlear fibers were observed crossing the tunnel of Corti to invade the OHC region. These fibers were generally straight, and hooked toward the hair cell (large arrow) just before making synaptic contact (small arrows in OHC region) in CRFR1+/+ mice. The TuJ1 antibody also revealed numerous fine filamentous processes (small arrows) along the region containing the IHCs. In CRFR1−/− mice (B), efferent fibers took an initially straight trajectory across the tunnel of Corti, but then meandered among OHCs (large arrows). Additionally, numerous fibers were found to take ectopic trajectories among the lateral support cell region (arrowhead). TuJ1 immunolabeling did not reveal fine filamentous processes among IHCs, mirroring the data obtained with NKA antibody, suggesting a paucity of synaptic contacts between IHCs and spiral ganglion cell processes. C, D, Efferent boutons were labeled using synaptophysin antibody. As described previously, wild-type CRFR1 mice exhibited an average of 2–3 efferent terminals per OHC (arrows). However, the CRFR1−/− mice exhibited a hyper-innervation to many (but not all) OHCs (arrows). This often took the form of 4–5 terminals per OHC. Additionally, unusual clusters of terminal rosettes were observed (dashed circles) that did not remain in register with the normal OHC soma arrangement (compare with A). E, A plot of the percentage of observations of the number of terminals found under each OHC of each row reveals the shift toward hyperinnervation of the OHCs in CRFR1−/− mice, especially in row 1 (closest to the tunnel of Corti; C, D, bottom). WT, Wild-type; KO, knock-out. Scale bars, 10 μm.

Similar articles

Cited by

References

    1. Barr CS, Dvoskin RL, Gupte M, Sommer W, Sun H, Schwandt ML, Lindell SG, Kasckow JW, Suomi SJ, Goldman D, Higley JD, Heilig M. Functional CRH variation increases stress-induced alcohol consumption in primates. Proc Natl Acad Sci U S A. 2009;106:14593–14598. - PMC - PubMed
    1. Brunton PJ, Sausbier M, Wietzorrek G, Sausbier U, Knaus HG, Russell JA, Ruth P, Shipston MJ. Hypothalamic-pituitary-adrenal axis hyporesponsiveness to restraint stress in mice deficient for large-conductance calcium- and voltage-activated potassium (BK) channels. Endocrinology. 2007;148:5496–5506. - PubMed
    1. Chen P, Vaughan J, Donaldson C, Vale W, Li C. Injection of Urocortin 3 into the ventromedial hypothalamus modulates feeding, blood glucose levels, and hypothalamic POMC gene expression but not the HPA axis. Am J Physiol Endocrinol Metab. 2010;298:E337–E345. - PMC - PubMed
    1. Chen Y, Bender RA, Brunson KL, Pomper JK, Grigoriadis DE, Wurst W, Baram TZ. Modulation of dendritic differentiation by corticotropin-releasing factor in the developing hippocampus. Proc Natl Acad Sci U S A. 2004;101:15782–15787. - PMC - PubMed
    1. Chen Y, Dubé CM, Rice CJ, Baram TZ. Rapid loss of dendritic spines after stress involves derangement of spine dynamics by corticotropin-releasing hormone. J Neurosci. 2008;28:2903–2911. - PMC - PubMed

Publication types

MeSH terms

Substances

LinkOut - more resources