

Spatiotemporal evolution of the functional magnetic resonance imaging response to ultrashort stimuli
- PMID: 21273428
- PMCID: PMC3078723
- DOI: 10.1523/JNEUROSCI.3986-10.2011
Spatiotemporal evolution of the functional magnetic resonance imaging response to ultrashort stimuli
Abstract
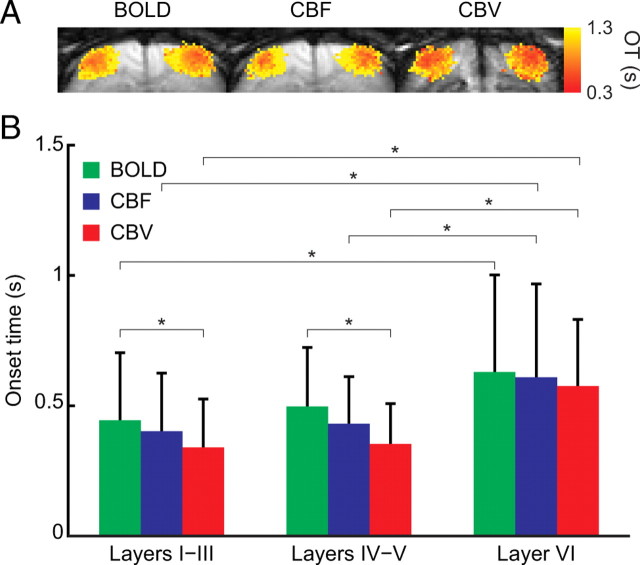
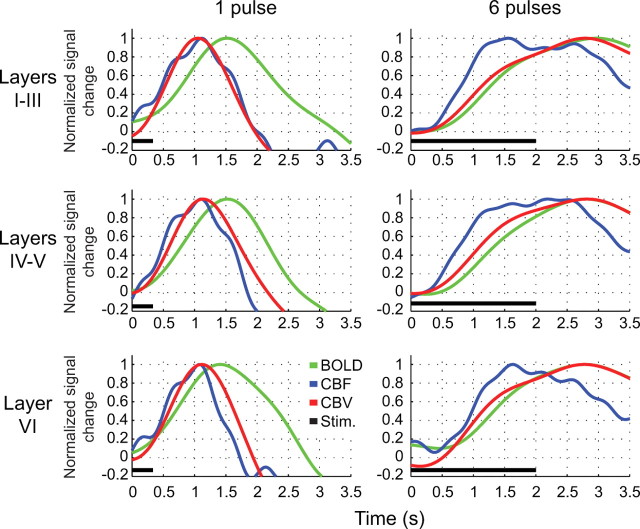
The specificity of the hemodynamic response function (HRF) is determined spatially by the vascular architecture and temporally by the evolution of hemodynamic changes. The stimulus duration has additional influence on the spatiotemporal evolution of the HRF, as brief stimuli elicit responses that engage only the local vasculature, whereas long stimuli lead to the involvement of remote vascular supply and drainage. Here, we used functional magnetic resonance imaging to investigate the spatiotemporal evolution of the blood oxygenation level-dependent (BOLD), cerebral blood flow (CBF), and cerebral blood volume (CBV) HRF to ultrashort forelimb stimulation in an anesthetized rodent model. The HRFs to a single 333-μs-long stimulus were robustly detected and consisted of a rapid response in both CBF and CBV, with an onset time (OT) of 350 ms and a full width at half-maximum of 1 s. In contrast, longer stimuli elicited a dispersive transit of oxygenated blood across the cortical microvasculature that significantly prolonged the evolution of the CBV HRF, but not the CBF. The CBF and CBV OTs suggest that vasoactive messengers are synthesized, released, and effective within 350 ms. However, the difference between the BOLD and CBV OT (∼100 ms) was significantly smaller than the arteriolar-venular transit time (∼500 ms), indicating an arterial contribution to the BOLD HRF. Finally, the rapid rate of growth of the active region with stimulus elongation suggests that functional hyperemia is an integrative process that involves the entire functional cortical depth. These findings offer a new view into the spatiotemporal dynamics of functional hemodynamic regulation in the brain.
Figures


Similar articles
-
Investigation of the BOLD and CBV fMRI responses to somatosensory stimulation in awake marmosets (Callithrix jacchus).NMR Biomed. 2018 Mar;31(3):10.1002/nbm.3864. doi: 10.1002/nbm.3864. Epub 2017 Dec 29. NMR Biomed. 2018. PMID: 29285809 Free PMC article.
-
Frequency-dependent neural activity, CBF, and BOLD fMRI to somatosensory stimuli in isoflurane-anesthetized rats.Neuroimage. 2010 Aug 1;52(1):224-33. doi: 10.1016/j.neuroimage.2010.03.064. Epub 2010 Mar 27. Neuroimage. 2010. PMID: 20350603 Free PMC article.
-
Chronic assessment of cerebral hemodynamics during rat forepaw electrical stimulation using functional ultrasound imaging.Neuroimage. 2014 Nov 1;101:138-49. doi: 10.1016/j.neuroimage.2014.06.063. Epub 2014 Jul 6. Neuroimage. 2014. PMID: 25008960
-
Linking brain vascular physiology to hemodynamic response in ultra-high field MRI.Neuroimage. 2018 Mar;168:279-295. doi: 10.1016/j.neuroimage.2017.02.063. Epub 2017 Feb 22. Neuroimage. 2018. PMID: 28254456 Review.
-
Biophysical and physiological origins of blood oxygenation level-dependent fMRI signals.J Cereb Blood Flow Metab. 2012 Jul;32(7):1188-206. doi: 10.1038/jcbfm.2012.23. Epub 2012 Mar 7. J Cereb Blood Flow Metab. 2012. PMID: 22395207 Free PMC article. Review.
Cited by
-
Time to wake up: Studying neurovascular coupling and brain-wide circuit function in the un-anesthetized animal.Neuroimage. 2017 Jun;153:382-398. doi: 10.1016/j.neuroimage.2016.11.069. Epub 2016 Nov 28. Neuroimage. 2017. PMID: 27908788 Free PMC article. Review.
-
"Overshoot" of O₂ is required to maintain baseline tissue oxygenation at locations distal to blood vessels.J Neurosci. 2011 Sep 21;31(38):13676-81. doi: 10.1523/JNEUROSCI.1968-11.2011. J Neurosci. 2011. PMID: 21940458 Free PMC article.
-
Investigation of the BOLD and CBV fMRI responses to somatosensory stimulation in awake marmosets (Callithrix jacchus).NMR Biomed. 2018 Mar;31(3):10.1002/nbm.3864. doi: 10.1002/nbm.3864. Epub 2017 Dec 29. NMR Biomed. 2018. PMID: 29285809 Free PMC article.
-
IRON fMRI measurements of CBV and implications for BOLD signal.Neuroimage. 2012 Aug 15;62(2):1000-8. doi: 10.1016/j.neuroimage.2012.01.070. Epub 2012 Jan 16. Neuroimage. 2012. PMID: 22281669 Free PMC article. Review.
-
Analysis of time and space invariance of BOLD responses in the rat visual system.Cereb Cortex. 2013 Jan;23(1):210-22. doi: 10.1093/cercor/bhs008. Epub 2012 Jan 31. Cereb Cortex. 2013. PMID: 22298731 Free PMC article.
References
-
- Ances BM, Zarahn E, Greenberg JH, Detre JA. Coupling of neural activation to blood flow in the somatosensory cortex of rats is time-intensity separable, but not linear. J Cereb Blood Flow Metab. 2000;20:921–930. - PubMed
-
- Barbier EL, Silva AC, Kim SG, Koretsky AP. Perfusion imaging using dynamic arterial spin labeling (DASL) Magn Reson Med. 2001;45:1021–1029. - PubMed
-
- Birn RM, Bandettini PA. The effect of stimulus duty cycle and “off” duration on BOLD response linearity. Neuroimage. 2005;27:70–82. - PubMed
Publication types
MeSH terms
Substances
Grants and funding
LinkOut - more resources
Full Text Sources