. 2011 Jan 26;31(4):1448-60.
doi: 10.1523/JNEUROSCI.3294-10.2011.

Regulation of synapse structure and function by distinct myosin II motors

Affiliations

Regulation of synapse structure and function by distinct myosin II motors

Maria D Rubio et al. J Neurosci. .

Abstract

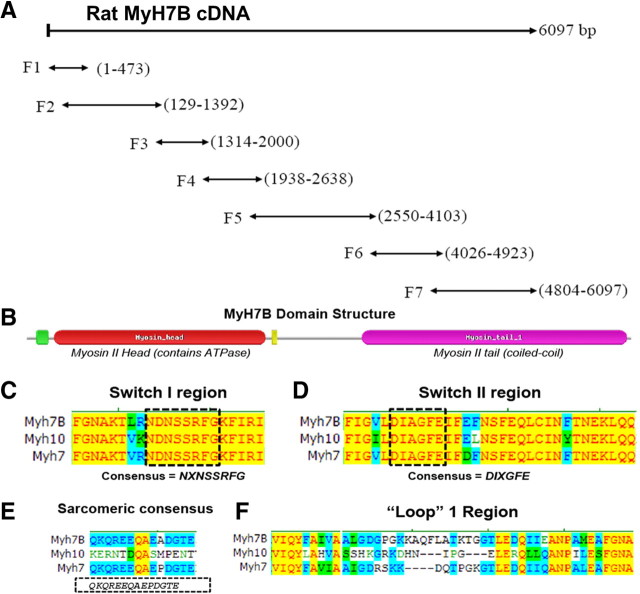
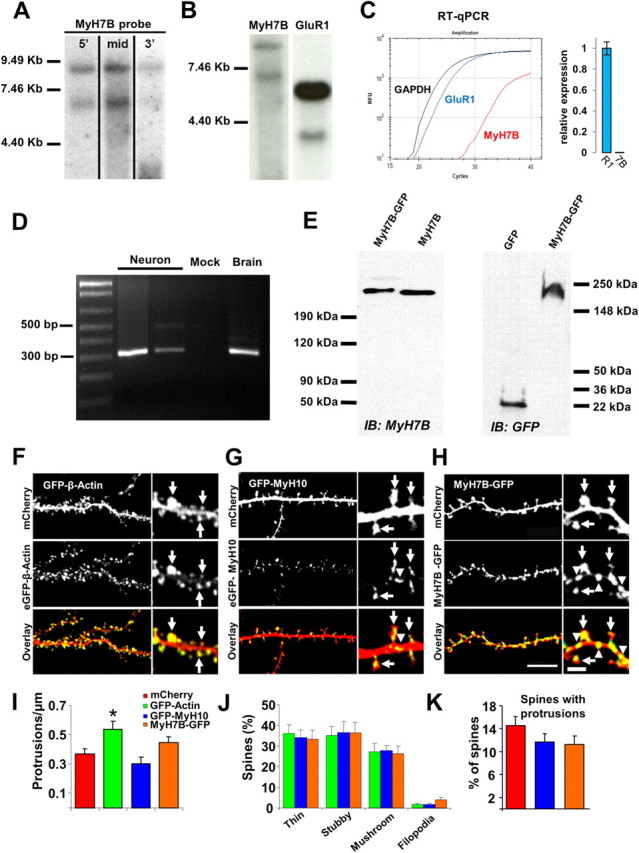
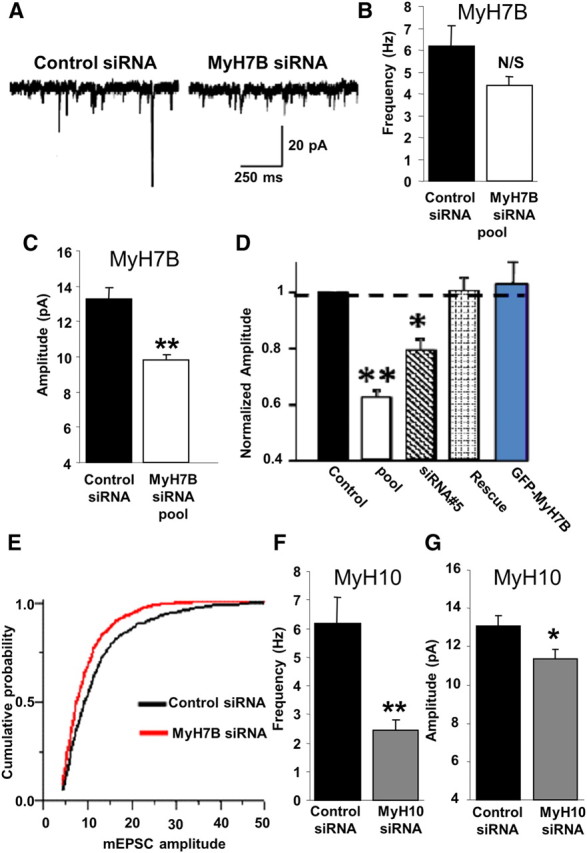
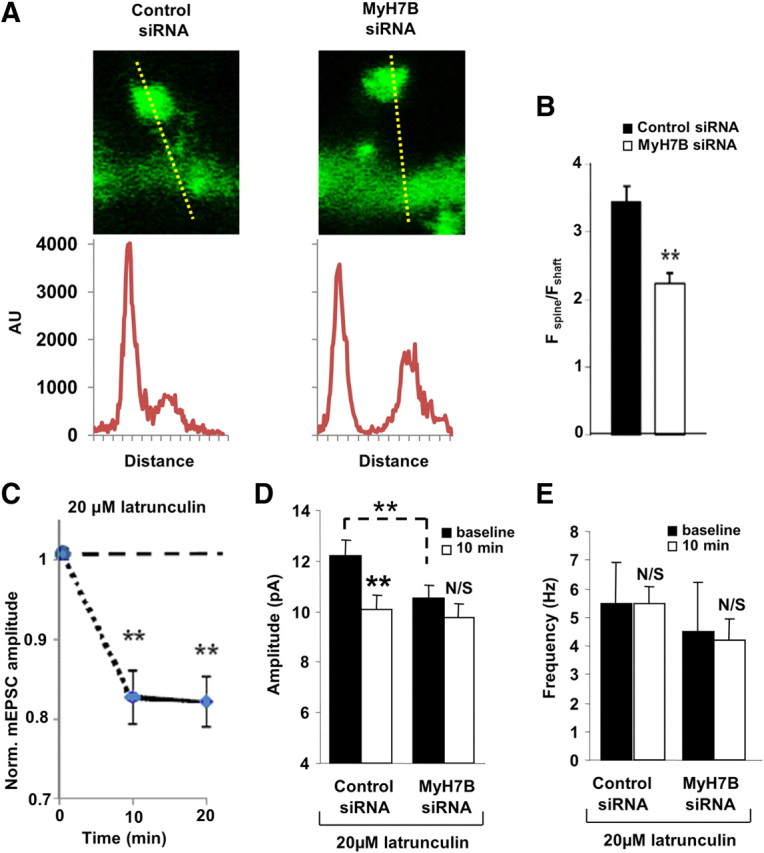
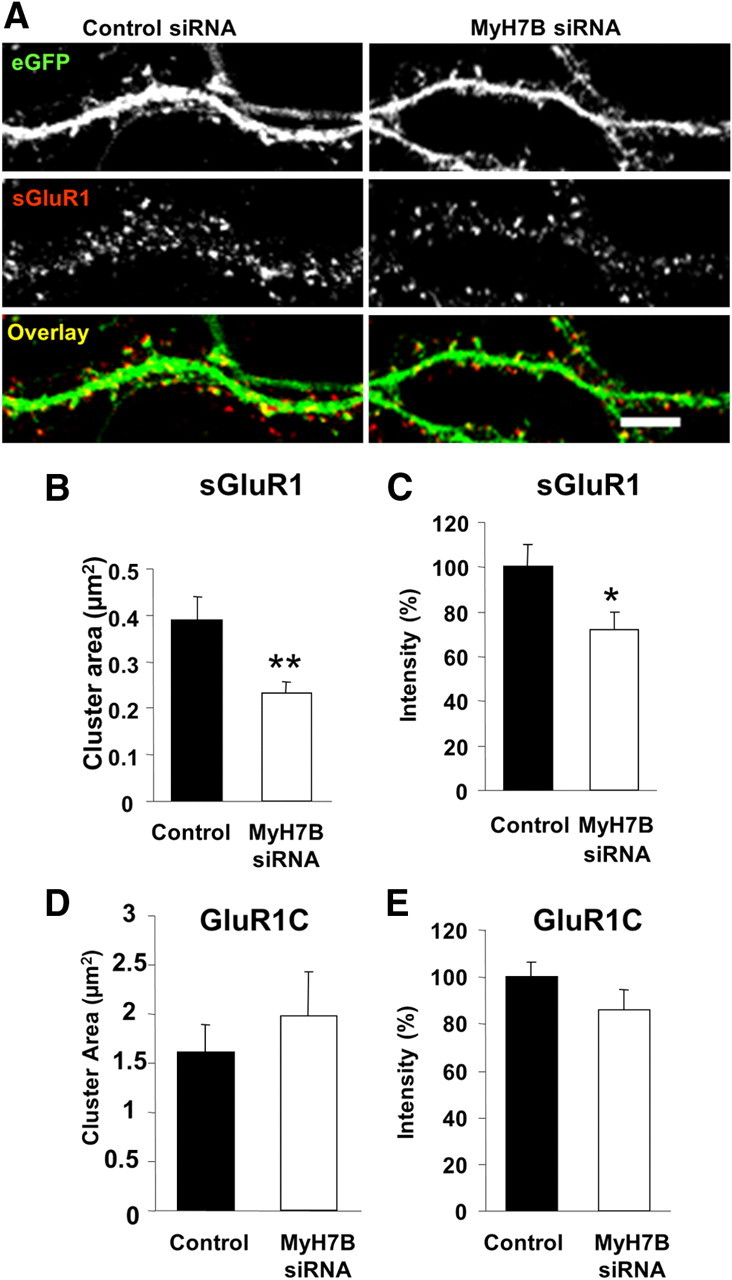
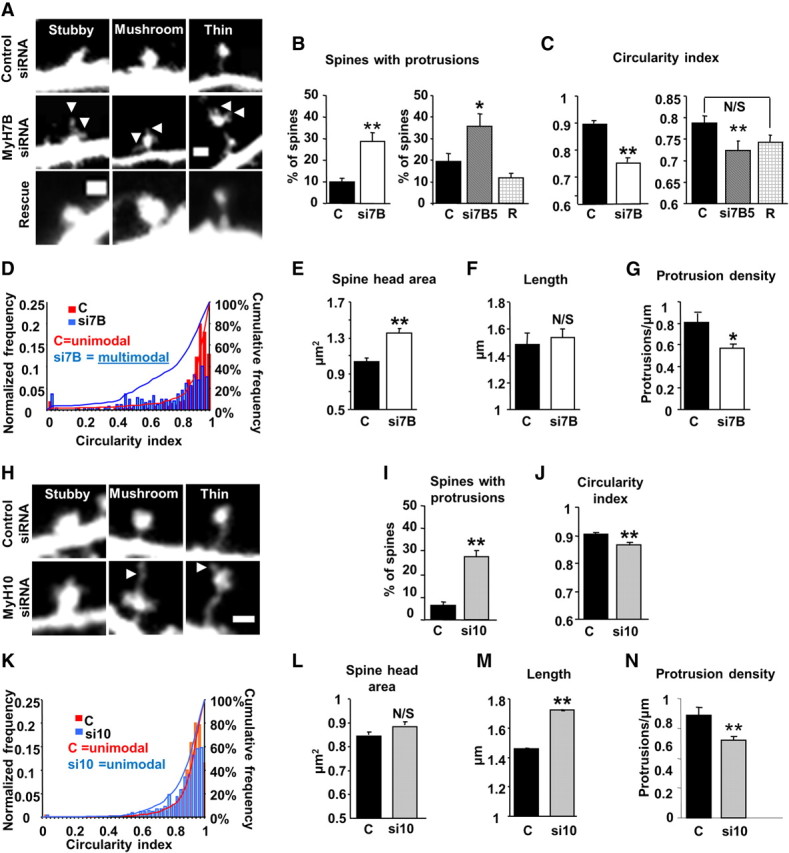
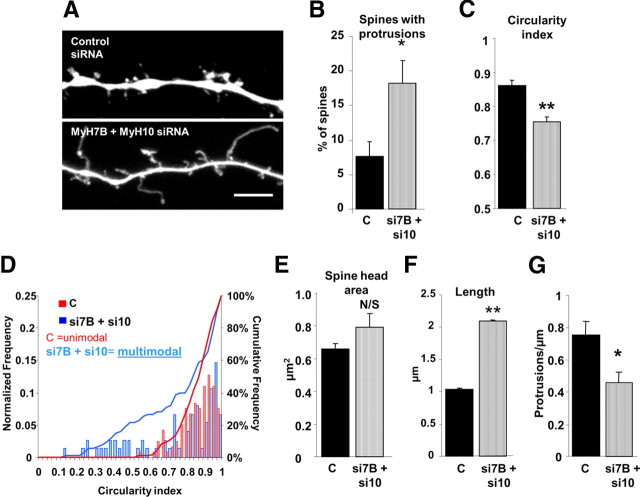
Ongoing synaptic function and rapid, bidirectional plasticity are both controlled by regulatory mechanisms within dendritic spines. Spine actin dynamics maintain synapse structure and function, and cytoskeletal rearrangements in these structures trigger structural and functional plasticity. Therefore, proteins that interact with actin filaments are attractive candidates to regulate synaptic actin dynamics and, thus, synapse structure and function. Here, we have cloned the rat isoform of class II myosin heavy chain MyH7B in brain. Unexpectedly, this isoform resembles muscle-type myosin II rather than the ubiquitously expressed nonmuscle myosin II isoforms, suggesting that a rich functional diversity of myosin II motors may exist in neurons. Indeed, reducing the expression of MyH7B in mature neurons caused profound alterations to dendritic spine structure and excitatory synaptic strength. Structurally, dendritic spines had large, irregularly shaped heads that contained many filopodia-like protrusions. Neurons with reduced MyH7B expression also had impaired miniature EPSC amplitudes accompanied by a decrease in synaptic AMPA receptors, which was linked to alterations of the actin cytoskeleton. MyH7B-mediated control over spine morphology and synaptic strength was distinct from that of a nonmuscle myosin, myosin IIb. Interestingly, when myosin IIb expression and MyH7B expression were simultaneously knocked-down in neurons, a third, more pronounced phenotype emerged. Together, our data provide evidence that distinct myosin II isoforms work together to regulate synapse structure and function in cultured hippocampal neurons. Thus, myosin II motor activity is emerging as a broad regulatory mechanism for control over complex actin networks within dendritic spines.


Figures

Figure 1.
Figure 1.
Cloning of a novel myosin II isoform from rat brain tissue. A, RT-PCR fragments on brain mRNA to deduce the putative coding sequence of MyH7B gene product. Seven overlapping fragments were generated (F1–F7), including a start methionine at F1 and a stop codon at F7. B, Domain structure of MyH7B protein. C, Alignment of MyH7B cDNA with a sarcomeric myosin II heavy chain (MyH7) and a nonmuscle myosin II heavy chain (MyH10) in the conserved switch I region. D, Alignment of MyH7B with MyH7 and MyH10 cDNAs in the conserved switch II region. E, Alignment of MyH7B with MyH7 and MyH10 cDNAs in a region that is conserved among sarcomeric or muscle-type myosin II isoforms. F, All myosin isoforms should contain a hyper-variable loop 1 region. MyH7B is not homologous to other myosin II isoforms in this region, which is suggestive of a distinct function.
Figure 2.
Figure 2.
MyH7B-GFP is localized to neurons and its exogenous overexpression does not alter dendritic spine density nor their architecture. A, Northern blot analysis of rat brain tissue with probes targeting three distinct regions of a putative MyH7B mRNA sequence. B, Northern blot analysis of rat brain tissue with probes targeted against MyH7B and GluR1 sequences, showing low expression levels of MyH7B. MyH7B was developed for 8 d while GluR1 was developed for 4 h. C, Left, Example traces from 250 ng of purified mRNA from adult rat hippocampus reverse transcribed and then amplified with GAPDH, GluR1, or MyH7B real-time PCR probes. Right, GluR1 (R1) and MyH7B (7B) relative expression levels in the hippocampus were determined by comparisons to the housekeeping gene GAPDH (see Materials and Methods). MyH7B (n = 3) expression relative to GLuR1 (n = 3) was then calculated by normalizing these two genes to each other. D, RT-PCR using primers directed against the C-terminal region of MyH7B, amplifying a 313bp fragment. Second and third lanes from the left (Neuron) correspond to cDNA from pure rat hippocampal neuronal cultures primed with oligo(dT)20 or random hexamers, respectively. Importantly, neuronal cultures conditions were modified to remove all traces of glia. Fourth lane from the left (Mock) contains sample buffer. Far right land (Brain) contains mRNA purified from adult rat forebrain. E, Left, MyH7B and MyH7B:GFP cDNAs were transfected into HEK293T cells. Two days later, cells were lysed and proteins were separated by SDS-PAGE. Samples were immunoblotted (IB) with custom-made anti-MyH7B IgG. Right, HEK293FS cells were transfected with GFP (left lane) and MyH7B:GFP (right lane) to confirm that GFP is fused to the full-length cDNA of MyH7B. Three days later cells were lysed and samples were immunoblotted with GFP monoclonal antibodies. F–H, Differential intracellular distribution of actin, MyH10 and MyH7B. Representative images of live DIV 18 primary hippocampal neuronal cultures cotransfected with mCherry (n = 6), mCherry and GFP:β-Actin (F, n = 5), GFP:MyH7B (G, n = 6), or MyH7B:GFP (H, n = 8). Arrows indicate location of dendritic spines. Arrowheads indicate dendritic localization. Scale bars (in H): left, 20 μm; right, 2 μm. I, Quantification of dendritic spine density expressed as number of protrusions per micrometer of the neurons shown in F, H). Neurons expressing GFP-actin show an increase in dendritic spine density compared with mCherry controls; mCherry: 0.37 ± 0.04; GFP-actin: 0.53 ± 0.06; GFP-MyH10: 0.3 ± 0.05; MyH7B-GFP: 0.45 ± 0.04. Data are expressed as mean ± SEM; one-way ANOVA followed by Fisher's LSD; *p < 0.05. J, Quantification of dendritic spine morphology expressed as a percentage of total spines counted. One-way ANOVA analysis within groups shows that overexpression of MyH7B-GFP does not modify dendritic spine morphology. Thin: GFP-actin: 35.9 ± 4.4%; GFP-MyH10: 34.06 ± 3.6%; MyH7B-GFP: 33.3 ± 4.3%. Stubby: GFP-actin: 35.1 ± 4.3%; GFP-MyH10: 36.5 ± 5.5%; MyH7B-GFP: 36.4 ± 5.2%. Mushroom: GFP-actin: 27.25 ± 4.1%; GFP-MyH10: 27.6 ± 2.8%; MyH7B-GFP: 26.4 ± 3.5%. Filopodia: GFP-Actin: 1.7 ± 4.1%; GFP-MyH10: 1.7 ± 2.8%; MyH7B-GFP: 3.9 ± 3.5%. Data are expressed as mean ± SEM. K. Quantification of dendritic spines with protrusions arising from their head expressed as a percentage of total spines counted. mCherry: 14.45 ± 1.6%; GFP-MyH10: 11.62 ± 1.5%; MyH7B-GFP: 11.21 ± 1.6%. One-way ANOVA analysis did not show significant differences among groups. Data are expressed as mean ± SEM.
Figure 3.
Figure 3.
Distinct regulation of synaptic function by MyH7B and MyH10 siRNAs. A, mEPSC traces were selected from whole-cell recordings of primary hippocampal neurons cotransfected with eGFP and control siRNA (n = 18) or a pool of four different siRNA sequences targeted to four different MyH7B regions (n = 19). B, Quantification of mEPSCs frequency for neurons recorded on A. Control siRNA: 6.17 Hz ± 0.92 Hz; MyH7B siRNA: 4.39 Hz ± 0.39 Hz. Student's t test statistical analysis did not show a statistical significance between groups; N/S, not significant. Data expressed as mean ± SEM. C, Quantification of mEPSCs amplitude for neurons recorded in A. Only mEPSCs with amplitudes > 4 pA were considered successful events. Control siRNA: 13.28 ± 0.65 pA, n = 18; MyH7B siRNA: 9.8 ± 0.3 pA, n = 19; Student's t test: **p < 0.01. Data are expressed as mean ± SEM. D, Normalized mEPSC amplitudes from several experiments looking at the effect of MyH7B on synaptic function. To arrive at the normalized amplitude, events from each neuron were averaged, and then the mean from all cells in a group was derived. In each condition, mean siRNA mEPSCs were normalized to control. Control refers to mEPSC amplitudes from neurons (13.8 ± 0.6 pA, n = 10) expressing control siRNA pools. Pool refers to the MyH7B-specific siRNA data shown in C. siRNA #5 refers to a single siRNA that effectively reduced mEPSC amplitude (11.8 ± 0.4 pA, n = 10) when compared with control siRNAs. Rescue refers to neurons coexpressing siRNA #5 together with a rescue construct (13.9 ± 0.5 pA, n = 8), which is a siRNA #5-insensitive MyH7B cDNA normalized to control siRNAs. GFP-MyH7B refers to neurons expressing the rescue construct by itself (16.2 ± 2.1 pA, n = 11) normalized to untransfected neighboring neurons (15.3 ± 1.5 pA, n = 11); *p < 0.05; **p < 0.01. Data are expressed as mean ± SEM. E, Cumulative probability distribution plotted from all events acquired from neurons transfected with control (n = 1256) or MyH7B-specific (n = 1471) siRNA pools. F, G, Mean mEPSC frequency and amplitude from neurons expressing GFP and control siRNA (n = 5; frequency: 6.18 Hz ± 0.9 Hz; amplitude: 13.06 ± 0.58 pA) or MyH10 siRNA pool (n = 6; frequency: 2.45 Hz ± 0.34 Hz; amplitude: 11.37 ± 0.5 pA); Student's t test: *p < 0.05; **p < 0.01. Data are expressed as mean ± SEM.
Figure 4.
Figure 4.
MyH7B maintains synaptic function through an actin-mediated mechanism. A, Representative image of a DIV 18 neuron expressing GFP-β-actin and either a pool of control siRNAs (left) or a pool of siRNAs targeted to MyH7B (right). A line scan through a spine and adjacent dendritic shaft yielded an intensity versus distance profile, allowing the assessment of relative actin density in these structures. AU, Arbitrary units. B, Quantification of the spine/shaft ratio of GFP-β-actin in neurons expressing control (n = 23 spines) or MyH7B-specific (n = 23 spines) siRNA pools; Student's t test: ** p < 0.01. Data are expressed as mean ± SEM. C, The effect of latrunculin A on mEPSC amplitude over time. Control nontransfected DIV 14–17 neurons (n = 6) were patch-clamped with 20 μm latrunculin or vehicle (DMSO) in the internal saline. At 2 min after “break-in,” events over next minute were average to yield a baseline mEPSC amplitude. Events were then averaged 10 and 20 min after baseline and these averages were normalized to that baseline; Student's t test: **p < 0.01. D, DIV 14–15 neurons were assessed for effects of latrunculin A in the presence of siRNAs. Comparison between mEPSC average amplitude at baseline (black bars) and after 10 min (white bars) in neurons transfected with mCherry and control siRNA pool (control siRNA, n = 6, baseline: 12.23 ± 0.59 pA; 10 min: 10.11 ± 0.57 pA) or MyH7B-specific siRNA pool (MyH7B siRNA, n = 7, baseline: 10.56 ± 0.47 pA; 10 min: 9.78 ± 0.53 pA) that were patch-clamped with 20 μm latrunculin A in the internal saline; Student's t test: **p < 0.01. Data are expressed as mean ± SEM. E, Average frequency plot of the cells tested in D. Control baseline: 5.5 Hz ± 1.41 Hz; 10 min: 5.47 Hz ± 1.74 Hz; MyH7B siRNA baseline: 4.48 Hz ± 0.59 Hz; 10 min: 4.21 Hz ± 0.71 Hz. Student's t test: N/S, not significant. Data expressed as mean ± SEM.
Figure 5.
Figure 5.
MyH7B regulates AMPAR surface expression at excitatory synapses. A, DIV 18 primary hippocampal neurons were cotransfected with eGFP and either control (left) or MyH7B siRNA (right) pools. Neurons were then stained for sGluR1, fixed, permeabilized, and stained for eGFP. Figure shows eGFP (top), GluR1 (center), and colocalization of both (bottom, yellow areas). Scale bar, 5 μm. B, Quantification of surface GluR1 cluster area from neurons cotransfected with eGFP and control (n = 5, 0.39 ± 0.05 μm2) or MyH7B siRNA pools (n = 7, 0.24 ± 0.024 μm2); Student's t test: **p < 0.01. Data expressed as mean ± SEM. C, Quantification of surface GluR1 cluster pixel intensity from the same neurons as in B. Control: 100% ± 10.02%; MyH7B siRNA pool: 71.86 ± 7.92%. Images were averaged and normalized to control. Data are expressed as mean percentage intensity of control neurons ± SEM. Student's t test: *p < 0.05. D, Quantification of total GluR1 cluster area from neurons cotransfected with eGFP and control (n = 5, 1.62 ± 0.27 μm2) or MyH7B siRNA pools (n = 7, 1.98 ± 0.45 μm2). Data are expressed as mean ± SEM. E, Quantification of total GluR1 cluster pixel intensity from the same neurons as in D. Control: 100 ± 6.6%; MyH7B siRNA pool: 86.5 ± 8.7%. Images were averaged and normalized to control. Data expressed as mean percentage intensity of control neurons ± SEM.
Figure 6.
Figure 6.
MyH10 and MyH7B have distinct effects on spine morphology. A, Representative stubby (left), mushroom (center), and thin (right) dendritic spines from a DIV 18 neuron cotransfected with mCherry and either control siRNA pool (top), MyH7B siRNA pool (middle) or MyH7B #5 and recue construct (bottom, Rescue). Arrowheads indicate filopodia-like protrusions extending from dendritic spine heads. Scale bars, 1 μm. B, Left: Quantification of dendritic spines showing protrusions arising from the heads of neurons transfected with mCherry and control siRNAs (C, n = 8, 9.99 ± 1.8%) or MyH7B siRNA pool (si7B, n = 8, 28.85 ± 4.16%); Student's t test: **p < 0.01. Data are expressed as mean ± SEM. Right: Quantification of dendritic spines showing protrusions arising from the heads of neurons transfected with mCherry and control siRNAs (C, n = 8, 19.24 ± 3.72%), MyH7B siRNA #5 (si7B5, n = 8, 35.55 ± 6.09%) or GFP-MyH7B rescue construct (R, n = 8, 12.01 ± 1.95%); one-way ANOVA followed by Fisher's LSD test: **p < 0.01. Data are expressed as mean ± SEM. C, The dendritic spine head circularity index of the neurons shown in A was measured to determine the degree of irregularity of the dendritic spine heads for each group. Circularity index = 4 * π * (area/perimeter2). Left: Circularity index of dendritic spine heads of neurons expressing mCherry and control (C, n = 8, CI: 0.89 ± 0.001) or a pool of MyH7B siRNAs (si7B, n = 7, CI: 0.75 ± 0.015); Student's t test: **p < 0.01. Data are expressed as mean ± SEM. Right: To test whether the effect of MyH7B knock-down on dendritic spine heads could be rescued, neurons transfected with mCherry and control siRNA pool (C, n = 8, CI: 0.79 ± 0.01), MyH7B siRNA #5 (si7B5, n = 8, CI: 0.72 ± 0.017), or MyH7B siRNA #5 and rescue construct (R, n = 8, CI: 0.74 ± 0.22) were analyzed for dendritic spine head circularity index; ANOVA followed by Fisher LSD; **p < 0.01; N/S, not significant. Data are expressed as mean ± SEM. D, Frequency distribution, cumulative frequency, and circularity index plot for DIV 18 neurons cotransfected with mCherry and control siRNA pool (red) or MyH7B siRNA pool (blue). The frequency distribution was normalized to the total number of spines measured (control, n = 272 dendritic spines; siRNA MyH7B pool, n = 248 dendritic spines). Hartigan's dip test: control, p < 0.01, unimodal distribution; MyH7B, p > 0.05, multimodal distribution. E, Quantification of dendritic spine head area in DIV 18 hippocampal neurons cotransfected with mCherry and control siRNA pool (n = 8, 1.04 μm2 ± 0.04 μm2) or MyH7B siRNA pool (n = 8, 1.36 μm2 ± 0.05 μm2). Student's t test: **p < 0.01. Data are expressed as mean ± SEM. F, Quantification of dendritic spine length from neurons expressing control (n = 8, 1.49 ± 0.08 μm) or MyH7B siRNAs (n = 8, 1.54 ± 0.07 μm). Student's t test: N/S, not significant. Data are expressed as mean ± SEM. G, Quantification of number of protrusions (dendritic spines plus filopodia) per micrometer of dendrite of neurons cotransfected with mCherry and control siRNA (0.19 ± 0.04) or MyH7B siRNA pool (0.24 ± 0.05); Student's t test: *p < 0.05. Data are expressed as mean ± SEM. H, Representative images of DIV 18 neurons that were transfected with mCherry and either control siRNAs (top, n = 11) or MyH10 siRNAs (bottom, n = 12). Dendritic spines were classified into stubby, mushroom, or thin following the same parameters as in A. Arrowheads indicate filopodia-like protrusions extending from dendritic spine heads. Scale bar, 1 μm. I, Quantification of dendritic spines showing protrusions arising from the heads of neurons transfected with mCherry and control siRNAs (C, n = 11, 6.5 ± 1.12%) or MyH10 siRNA pool (si10, n = 12, 27.89 ± 2.38%). Student's t test: **p < 0.01. Data expressed as mean ± SEM. J, Circularity index of dendritic spine heads from neurons described in H. Control: CI: 0.9 ± 0.006, MyH10 siRNA: CI: 0.87 ± 0.01; Student's t test: **p < 0.01. Data are expressed as mean ± SEM. K, Frequency distribution, cumulative frequency, and circularity index plot for of dendritic spine heads of neurons transfected with control or MyH10 siRNAs. The frequency distribution was normalized to the total number of spines measured (control n = 833, siRNA MyH10, n = 752). Hartigan's dip test: control, p < 0.01 unimodal distribution; MyH10, p < 0.05, unimodal distribution. L, Quantification of dendritic spine head area in neurons described in H. Control: 0.85 μm2 ± 0.03 μm2; MyH10 siRNA pool: 0.89 μm2 ± 0.04 μm2); Student's t test: N/S, Not significant. Data are expressed as mean ± SEM. M, Quantification of dendritic spine length from neurons transfected with control (1.46 ± 0.005 μm) or MyH10 siRNAs (1.72 ± 0.005 μm); Student's t test: **p < 0.01. Data are expressed as mean ± SEM. N, Quantification of number of protrusions per micrometer of dendrite of neurons cotransfected with mCherry and control (0.69 ± 0.05) or MyH10 siRNA pool (0.52 ± 0.03); Student's t test: **p < 0.01. Data are expressed as mean ± SEM.
Figure 7.
Figure 7.
MyH10 and MyH7B siRNAs show an additive effect on dendritic spine morphology. A, Representative images of DIV 18 neurons that were transfected with mCherry and either control siRNAs (top, n = 7) or MyH10 plus MyH7B siRNAs (bottom, n = 7). Dendritic spines were classified into stubby, mushroom, or thin following the same parameters as in Figure 7. Scale bar, 5 μm. B, Quantification of dendritic spines showing protrusions arising from the heads of neurons transfected with mCherry and control siRNAs (C, 7.68 ± 2.02%) or MyH7B plus MyH10 siRNAs (si7B + si10, 18.19 ± 3.33%); Student's t test: *p < 0.05. Data expressed as mean ± SEM. C, Circularity index of dendritic spine heads of neurons transfected with control (0.86 ± 0.02) or MyH7B plus MyH10 (0.75 ± 0.01) siRNAs. Student's t test: **p < 0.01. Data are expressed as mean ± SEM. D, Frequency distribution, cumulative frequency, and circularity index plot for of dendritic spine heads of neurons transfected with control or MyH7B plus MyH10 siRNAs. The frequency distribution was normalized to the total number of spines counted (control, n = 118; siRNA MyH7B, n = 75). Hartigan's dip test: Control, p < 0.05, unimodal distribution, MyH10, p > 0.05, multimodal distribution. E, Quantification of dendritic spine head area of neurons transfected with control (0.66 ± 0.04 μm2) or MyH7B plus MyH10 siRNAs (0.79 μm2 ± 0.09 μm2); Student's t test: N/S, not significant. Data are expressed as mean ± SEM. F, Quantification of dendritic spine length from neurons transfected with control (1.04 ± 0.04 μm) or MyH7B plus MyH10 siRNAs (2.09 ± 0.03 μm); Student's t test: **p < 0.01. Data are expressed as mean ± SEM. G, Quantification of number of protrusions per micrometer of dendrite of neurons cotransfected with mCherry and control (0.75 ± 0.09) or MyH7B and MyH10 siRNA pools (0.46 ± 0.06); Student's t test: *p < 0.05. Data are expressed as mean ± SEM.

Similar articles

Cited by

References

    1. Allison DW, Gelfand VI, Spector I, Craig AM. Role of actin in anchoring postsynaptic receptors in cultured hippocampal neurons: differential attachment of NMDA versus AMPA receptors. J Neurosci. 1998;18:2423–2436. - PMC - PubMed
    1. Amaral DG, Dent JA. Development of the mossy fibers of the dentate gyrus: I. A light and electron microscopic study of the mossy fibers and their expansions. J Comp Neurol. 1981;195:51–86. - PubMed
    1. Banke TG, Bowie D, Lee H, Huganir RL, Schousboe A, Traynelis SF. Control of GluR1 AMPA receptor function by cAMP-dependent protein kinase. J Neurosci. 2000;20:89–102. - PMC - PubMed
    1. Carlisle HJ, Manzerra P, Marcora E, Kennedy MB. SynGAP regulates steady-state and activity-dependent phosphorylation of cofilin. J Neurosci. 2008;28:13673–13683. - PMC - PubMed
    1. Cheng XT, Hayashi K, Shirao T. Non-muscle myosin IIB-like immunoreactivity is present at the drebrin-binding cytoskeleton in neurons. Neurosci Res. 2000;36:167–173. - PubMed

Publication types

MeSH terms

LinkOut - more resources