Protein quantification at the single vesicle level reveals that a subset of synaptic vesicle proteins are trafficked with high precision
- PMID: 21273430
- PMCID: PMC3078718
- DOI: 10.1523/JNEUROSCI.3805-10.2011
Protein quantification at the single vesicle level reveals that a subset of synaptic vesicle proteins are trafficked with high precision
Abstract
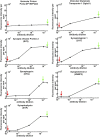
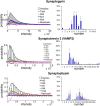
Protein sorting represents a potential point of regulation in neurotransmission because it dictates the protein composition of synaptic vesicles, the organelle that mediates transmitter release. Although the average number of most vesicle proteins has been estimated using bulk biochemical approaches (Takamori et al., 2006), no information exists on the intervesicle variability of protein number, and thus on the precision with which proteins are sorted to vesicles. To address this, we adapted a single molecule quantification approach (Mutch et al., 2007) and used it to quantify both the average number and variance of seven integral membrane proteins in brain synaptic vesicles. We report that four vesicle proteins, SV2, the proton ATPase, Vglut1, and synaptotagmin 1, showed little intervesicle variation in number, indicating they are sorted to vesicles with high precision. In contrast, the apparent number of VAMP2/synaptobrevin 2, synaptophysin, and synaptogyrin demonstrated significant intervesicle variability. These findings place constraints on models of protein function at the synapse and raise the possibility that changes in vesicle protein expression affect vesicle composition and functioning.
Figures


Similar articles
-
The synaptic vesicle proteins SV2, synaptotagmin and synaptophysin are sorted to separate cellular compartments in CHO fibroblasts.J Cell Biol. 1993 Nov;123(3):575-84. doi: 10.1083/jcb.123.3.575. J Cell Biol. 1993. PMID: 7901222 Free PMC article.
-
Synaptophysin I controls the targeting of VAMP2/synaptobrevin II to synaptic vesicles.Mol Biol Cell. 2003 Dec;14(12):4909-19. doi: 10.1091/mbc.e03-06-0380. Epub 2003 Oct 3. Mol Biol Cell. 2003. PMID: 14528015 Free PMC article.
-
Heterogeneity of glutamatergic and GABAergic release machinery in cerebral cortex: analysis of synaptogyrin, vesicle-associated membrane protein, and syntaxin.Neuroscience. 2010 Feb 3;165(3):934-43. doi: 10.1016/j.neuroscience.2009.11.009. Epub 2009 Nov 10. Neuroscience. 2010. PMID: 19909789
-
Synaptic vesicle protein trafficking at the glutamate synapse.Neuroscience. 2009 Jan 12;158(1):189-203. doi: 10.1016/j.neuroscience.2008.03.029. Epub 2008 Mar 22. Neuroscience. 2009. PMID: 18472224 Free PMC article. Review.
-
Synaptic vesicle proteins and regulated exocytosis.J Cell Sci Suppl. 1993;17:75-9. doi: 10.1242/jcs.1993.supplement_17.11. J Cell Sci Suppl. 1993. PMID: 8144706 Review.
Cited by
-
Axonal and dendritic synaptotagmin isoforms revealed by a pHluorin-syt functional screen.Mol Biol Cell. 2012 May;23(9):1715-27. doi: 10.1091/mbc.E11-08-0707. Epub 2012 Mar 7. Mol Biol Cell. 2012. PMID: 22398727 Free PMC article.
-
Emerging Perspectives on Dipeptide Repeat Proteins in C9ORF72 ALS/FTD.Front Cell Neurosci. 2021 Feb 18;15:637548. doi: 10.3389/fncel.2021.637548. eCollection 2021. Front Cell Neurosci. 2021. PMID: 33679328 Free PMC article. Review.
-
Key physiological parameters dictate triggering of activity-dependent bulk endocytosis in hippocampal synapses.PLoS One. 2012;7(6):e38188. doi: 10.1371/journal.pone.0038188. Epub 2012 Jun 4. PLoS One. 2012. PMID: 22675521 Free PMC article.
-
A proline-rich motif on VGLUT1 reduces synaptic vesicle super-pool and spontaneous release frequency.Elife. 2019 Oct 30;8:e50401. doi: 10.7554/eLife.50401. Elife. 2019. PMID: 31663854 Free PMC article.
-
Imaging the fetal nonhuman primate brain with SV2A positron emission tomography (PET).Eur J Nucl Med Mol Imaging. 2022 Sep;49(11):3679-3691. doi: 10.1007/s00259-022-05825-6. Epub 2022 May 28. Eur J Nucl Med Mol Imaging. 2022. PMID: 35633376 Free PMC article.
References
-
- Alés E, Tabares L, Poyato JM, Valero V, Lindau M, Alvarez de Toledo G. High calcium concentrations shift the mode of exocytosis to the kiss-and-run mechanism. Nat Cell Biol. 1999;1:40–44. - PubMed
-
- Aravanis AM, Pyle JL, Tsien RW. Single synaptic vesicles fusing transiently and successively without loss of identity. Nature. 2003;423:643–647. - PubMed
-
- Burré J, Beckhaus T, Schägger H, Corvey C, Hofmann S, Karas M, Zimmermann H, Volknandt W. Analysis of the synaptic vesicle proteome using three gel-based protein separation techniques. Proteomics. 2006;6:6250–6262. - PubMed
Publication types
MeSH terms
Substances
Grants and funding
LinkOut - more resources
Full Text Sources
Other Literature Sources
