. 2011 Jan 26;31(4):1507-15.
doi: 10.1523/JNEUROSCI.4880-10.2011.

The role of striatal tonically active neurons in reward prediction error signaling during instrumental task performance

Affiliations

The role of striatal tonically active neurons in reward prediction error signaling during instrumental task performance

Paul Apicella et al. J Neurosci. .

Abstract

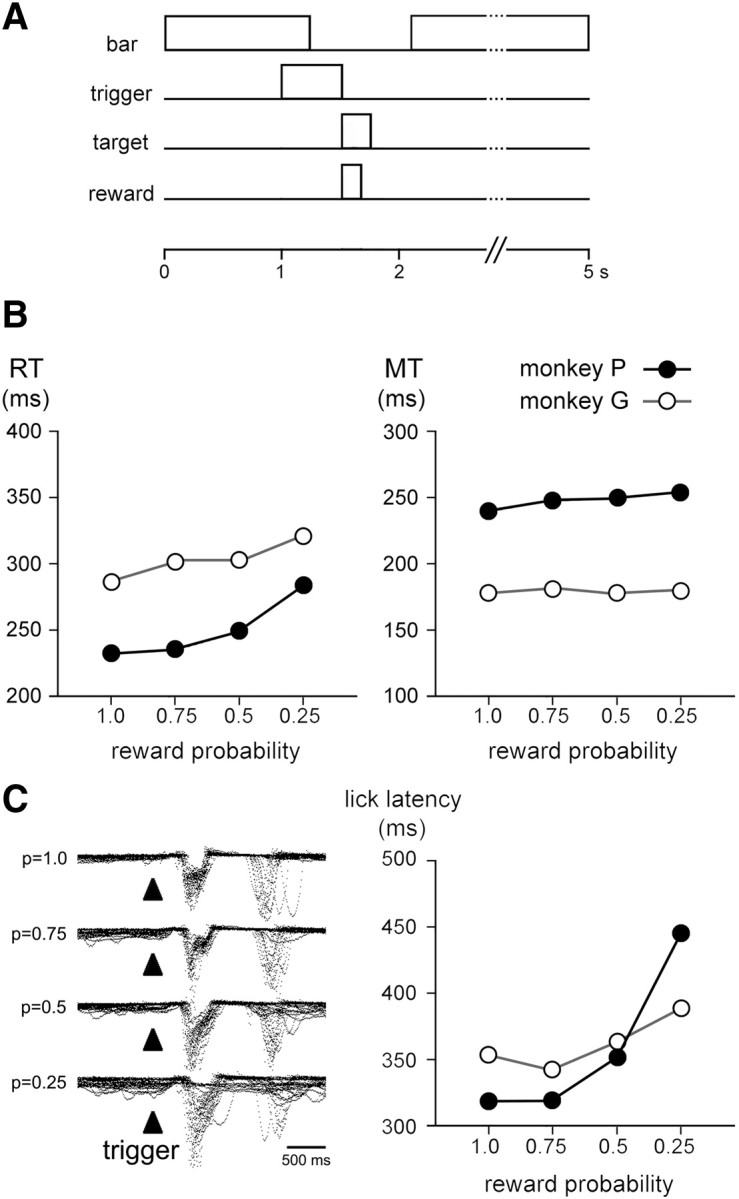
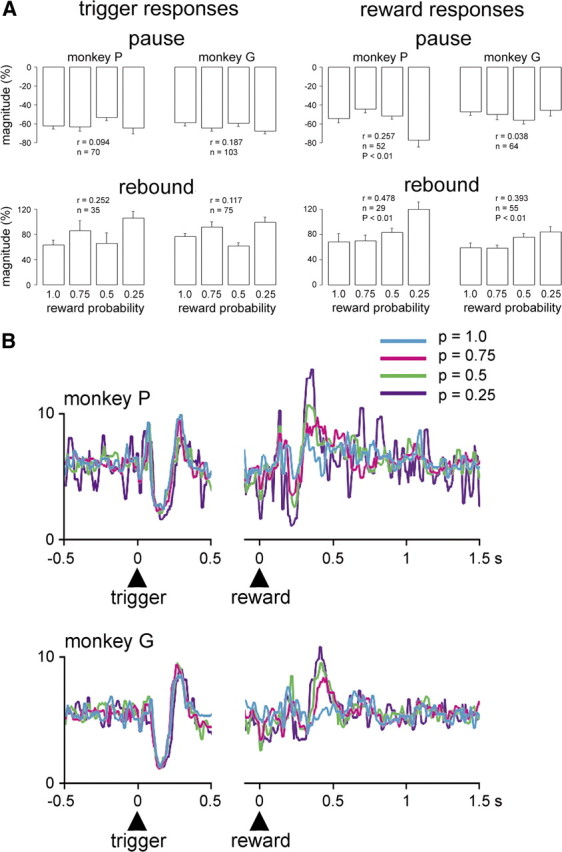
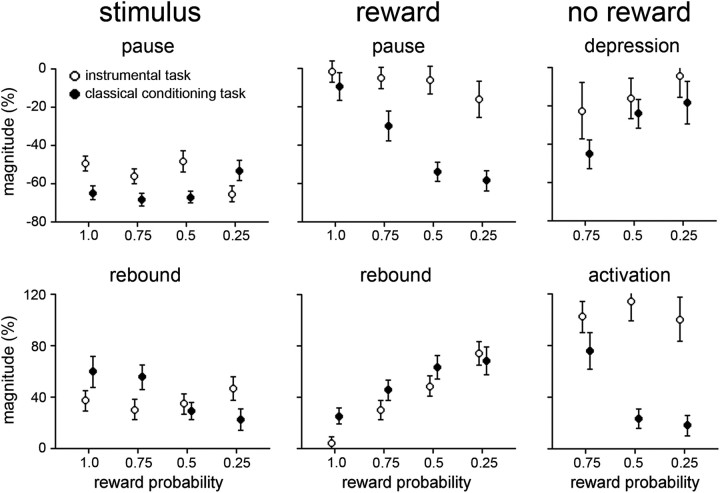
The detection of differences between predictions and actual outcomes is important for associative learning and for selecting actions according to their potential future reward. There are reports that tonically active neurons (TANs) in the primate striatum may carry information about errors in the prediction of rewards. However, this property seems to be expressed in classical conditioning tasks but not during performance of an instrumental task. To address this issue, we recorded the activity of TANs in the putamen of two monkeys performing an instrumental task in which probabilistic rewarding outcomes were contingent on an action in block-design experiments. Behavioral evidence suggests that animals adjusted their performance according to the level of probability for reward on each trial block. We found that the TAN response to reward was stronger as the reward probability decreased; this effect was especially prominent on the late component of the pause-rebound pattern of typical response seen in these neurons. The responsiveness to reward omission was also increased with increasing reward probability, whereas there were no detectable effects on responses to the stimulus that triggered the movement. Overall, the modulation of TAN responses by reward probability appeared relatively weak compared with that observed previously in a probabilistic classical conditioning task using the same block design. These data indicate that instrumental conditioning was less effective at demonstrating prediction error signaling in TANs. We conclude that the sensitivity of the TAN system to reward probability depends on the specific learning situation in which animals experienced the stimulus-reward associations.


Figures

Figure 1.
Figure 1.
Temporal sequence of task events and behavior at different reward probabilities. A, Reaching task used for behavioral testing. A trial started with the monkey with its hand on a bar waiting for the trigger stimulus. In response to the presentation of this stimulus, the animal released the bar and reached the target. Depending upon the reward probabilities, target contact resulted in either the delivery or omission of reward. Four different probabilities of reward (0.25, 0.5, 0.75, and 1.0) were tested in separate blocks of 40–70 trials and the same stimulus served as a trigger for movement. Irregular time intervals of 4.0–4.7 s occurred between reward delivery and the subsequent trigger stimulus. B, Reaching task performance as a function of the reward probability for the two monkeys. Each value was obtained by calculating the mean for all trials. The data for each probability condition were taken from 689, 1333, 1240, and 526 trials for monkey P and 792, 1432, 1041, and 1394 trials for monkey G at p = 1.0, 0.75, 0.5, and 0.25, respectively. Error bars representing SEM are too small to be visible. C, Licking behavior at different reward probabilities. Left, Superimposed traces of mouth movement records are aligned on the onset of the trigger stimulus. Data were obtained from ∼20 consecutive trials in each condition collected in monkey P. Right, Latencies of licking movements for each animal and each probability condition. Data were obtained from 266, 305, 296, and 216 trials for monkey P and 159, 158, 149, and 135 trials for monkey G at p = 1.0, 0.75, 0.5, and 0.25, respectively. Error bars representing SEM are too small to be visible.
Figure 2.
Figure 2.
Recording sites of TANs in monkey P. TANs responding to reward that were or were not influenced by probability are indicated by symbols on coronal sections of the putamen. AC −5 to 0, Levels posterior to the anterior commissure.
Figure 3.
Figure 3.
Influence of changing the probability of reward on TAN responses to the trigger stimulus and reward. An example of a responding TAN tested in the four reward probability conditions. The change in reward probability occurred over four successive blocks of trials and only rewarded trials are shown. The TAN response to reward was decreased when the reward was fully predictable. Each dot indicates a neuronal impulse and each line of dots gives the neuronal activity recorded during a single trial. Dot displays and perievent time histograms are aligned on the onset of the trigger stimulus (left) and reward (right). In each block, rasters are in chronological order from top to bottom. Dots in raster displays indicate movement onset (bar release). Histogram scale is in impulses/s. Bin width for histograms is 10 ms.
Figure 4.
Figure 4.
Modulation by reward probability of population responses of TANs to task events in rewarded trials. A, Comparison of magnitudes of the two components of TAN responses to the trigger stimulus and reward delivery in relation to different reward probability levels. The magnitude of initial pauses (monkey P) and later rebound activations (monkeys P and G) following reward delivery increased linearly with decreasing probability. In contrast, the magnitude of both response components to the trigger stimulus was not significantly correlated with the probability of reward. Each bar represents the mean ± SEM. Numbers of values at the different probability levels varied between 4 and 23 in monkey P and 11 and 29 in monkey G. r, Correlation coefficient. B, Population activities for all TANs recorded at each level of probability are superposed and separately referenced to the trigger stimulus (left) and reward (right). Numbers of neurons at p = 1.0, 0.75, 0.5, and 0.25 for monkey P are as follows: n = 32, 21, 29, and 10, respectively; for monkey G, n = 36, 31, 33, and 27, respectively. Vertical scale denotes impulses/s.
Figure 5.
Figure 5.
Changes in TAN activity when expected rewards were omitted in unrewarded trials. A, Comparison of magnitudes of changes in activity following the omission of reward as a function of reward probability. Results are pooled for the two monkeys. Numbers of values at p = 0.75, 0.5, and 0.25 for neurons showing a decrease in activity after reward omission are 17, 22, and 9, respectively (left); for neurons showing an increase in activity after reward omission, 16, 24, and 12, respectively (right). Values are given as means ± SEM. r, Correlation coefficient. B, Population activities for TANs responding to reward omission. Neurons were separated into two groups according to the direction of their response to no reward, namely increase or decrease in activity. Same numbers of neurons as in A. Vertical scale denotes impulses/s.
Figure 6.
Figure 6.
Comparison of magnitudes of each component of population responses of TANs during performance of the instrumental and classical tasks. Plots show, separately for the two tasks, mean magnitude of population responses to the stimulus, reward delivery, and reward omission according to the probability of reward. Values correspond to pooled data from monkeys P and G trained in the two tasks. Error bars represent SEs of mean magnitude. In the instrumental task, the numbers of neurons contributing to the graph are the same as those in Figures 4 and 5. In the classical conditioning task, number of neurons at p = 1.0, 0.75, 0.5, and 0.25 are 61, 36, 44, and 40, respectively; Number of neurons at p = 0.75, 0.5, and 0.25 for activity changes after reward omission are as follows: for depression, n = 11, 8, and 3, respectively; for activation, 11, 18, and 17, respectively.

References

    1. Aosaki T, Tsubokawa H, Ishida A, Watanabe K, Graybiel AM, Kimura M. Responses of tonically active neurons in the primate's striatum undergo systematic changes during behavioral sensorimotor conditioning. J Neurosci. 1994;14:3969–3984. - PMC - PubMed
    1. Aosaki T, Kimura M, Graybiel AM. Temporal and spatial characteristics of tonically active neurons of the primate's striatum. J Neurophysiol. 1995;73:1234–1252. - PubMed
    1. Apicella P. Leading tonically active neurons of the striatum from reward detection to context recognition. Trends Neurosci. 2007;30:299–306. - PubMed
    1. Apicella P, Legallet E, Trouche E. Responses of tonically discharging neurons in the monkey striatum to primary rewards delivered during different behavioral states. Exp Brain Res. 1997;116:456–466. - PubMed
    1. Apicella P, Deffains M, Ravel S, Legallet E. Tonically active neurons in the striatum differentiate between delivery and omission of expected reward in a probabilistic task context. Eur J Neurosci. 2009;30:515–526. - PubMed

Publication types

LinkOut - more resources