. 2011 Mar;25(3):529-45.
doi: 10.1210/me.2010-0384. Epub 2011 Jan 27.

Research resource: Comparative nuclear receptor atlas: basal and activated peritoneal B-1 and B-2 cells

Affiliations

Research resource: Comparative nuclear receptor atlas: basal and activated peritoneal B-1 and B-2 cells

Cody J Diehl et al. Mol Endocrinol. 2011 Mar.

Abstract

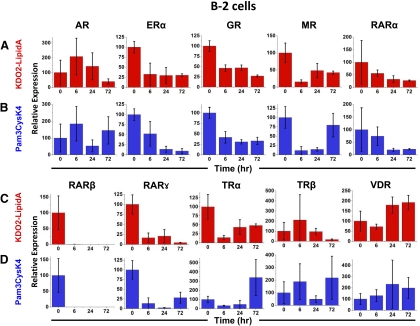
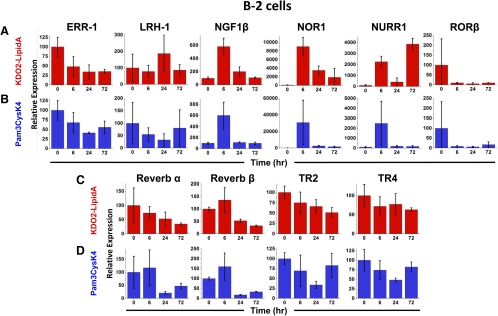
Naïve murine B cells are typically divided into three subsets based on functional and phenotypic characteristics: innate-like B-1 and marginal zone B cells vs. adaptive B-2 cells, also known as follicular or conventional B cells. B-1 cells, the innate-immune-like component of the B cell lineage are the primary source of natural antibodies and have been shown to modulate autoimmune diseases, human B-cell leukemias, and inflammatory disorders such as atherosclerosis. On the other hand, B-2 cells are the principal mediators of the adaptive humoral immune response and represent an important pharmacological target for various conditions including rheumatoid arthritis, lupus erythematosus, and lymphomas. Using the resources of the Nuclear Receptor Signaling Atlas program, we used quantitative real-time PCR to assess the complement of the 49 murine nuclear receptor superfamily expressed in quiescent and toll-like receptor (TLR)-stimulated peritoneal B-1 and B-2 cells. We report the expression of 24 nuclear receptors in basal B-1 cells and 25 nuclear receptors in basal B-2 cells, with, in some cases, dramatic changes in response to TLR 4 or TLR 2/1 stimulation. Comparative nuclear receptor profiling between B-1 and peritoneal B-2 cells reveals a highly concordant expression pattern, albeit at quantitatively dissimilar levels. We also found that splenic B cells express 23 nuclear receptors. This catalog of nuclear receptor expression in B-1 and B-2 cells provides data to be used to better understand the specific roles of nuclear receptors in B cell function, chronic inflammation, and autoimmune disease.


Figures

Fig. 1.
Fig. 1.
Experimental design. Peritoneal B-1 or B-2 cells were isolated from CB57BL6/J mice using fluorescence activated cell sorting (FACS). B-1 cells were selected as CD3 (gate not shown), CD19+, and CD23 and B-2 cells as CD3 (gate not shown), CD19+, and CD23+. Primary B-1 or B-2 cells were exposed to Kdo2-lipid A or Pam3CysK4 and harvested at the indicated time points. Samples were processed and subjected to quantitative PCR analysis.
Fig. 2.
Fig. 2.
The composition of nuclear receptors expressed in peritoneal B-1 and B-2 cells. A, Twenty-four of 49 known nuclear receptors are expressed in the peritoneal B-1 cell. These include eight endocrine receptors, six adopted orphan receptors that bind low-affinity dietary lipids, and 10 orphan receptors, including six constitutive activators and four constitutive repressors. B and D, Tabular listing of nuclear receptors expressed or nonexpressed in peritoneal B-1 cells (B) or peritoneal B-2 cells (D) with their unified nomenclature system names listed in parentheses (94). C, Twenty-five of 49 known nuclear receptors are expressed in peritoneal B-2 cells. These include 10 endocrine receptors, five adopted orphan receptors that bind low-affinity dietary lipids, and 10 orphan receptors, including six constitutive activators and four constitutive repressors. Receptors were deemed unexpressed if Ct values exceeded 35. The actual Ct values are given in Supplemental Table 1 in comparison with simultaneously determined Ct values for the same receptors in splenic B cells and bone marrow-derived macrophages. *, Trace or inconsistent expression detectable. PR, Progesterone receptor; CAR, constitutive androstane receptor; FXR, farnesoid x receptor; PXR, pregane x receptor; TR2, testicular orphan receptor 2; TR4, testicular orphan receptor 4; COUP TF, chicken ovalbumin upstream promoter transcription factor; Dax1, dosage-sensitive sex reversal-adrenal hypoplasia congenital critical region on the X chromosome, gene 1; GCNF, germ cell nuclear factor; HNF4, hepatocyte nuclear factor-4; PNR, photoreceptor-specific nuclear receptor; SF-1, steroidogenic factor-1; SHP, small heterodimeric partner; TLX, tailless homolog.
Fig. 3.
Fig. 3.
Relative nuclear receptor expression in basal B-2 cells vs. basal B-1 cells. Basal expression at time zero (normalized to 36B4) in peritoneal B-2 cells relative to peritoneal B-1 cells. B-2 cells displayed moderately higher expression of many of the nuclear receptors and marked enhanced expression of RARβ, TRβ, LRH-1, and RORβ. In contrast, MR and PPARα expression levels were dramatically higher in B-1 cells.
Fig. 4.
Fig. 4.
Basal and stimulated expression profiles of B-1 cell endocrine nuclear receptors. A and D, Endocrine receptors in basal peritoneal B-1 cells generally display dynamic expression. ERα and TRβ display an initial peak in expression followed by down-regulation. GR, MR, RARγ, TRα, and VDR generally up-regulate expression over time. RARα expression is not altered. B and E, Kdo2-lipid A appears to induce the expression of TRβ and VDR. It has no effect on ERα or TRα expression levels. MR and RARγ were initially down-regulated but then had increasing expression at subsequent time points. GR and RARα were down-regulated. C and F, Pam3CSK4 had the same general effect as Kdo2-lipid A on GR, MR, RARα, RARγ, TRβ, and VDR expression. TRα was up-regulated and ERα was down-regulated. Basal expression at time zero (normalized to 36B4) was assigned an expression value of 100, and subsequent time points are relative to time zero. Error bars represent sd.
Fig. 5.
Fig. 5.
Stimulated expression profiles of B-2 cell endocrine nuclear receptors. A and C, Treatment of peritoneal B-2 cells with Kdo2-lipidA, a TLR4 ligand. This led to a general down-regulation of ERα, GR, MR, RARα, RARβ, RARγ, and TRα mRNA levels. AR and TRβ mRNA levels were initially up-regulated followed by subsequent down-regulation. VDR expression levels slightly decreased initially but increased at later time points. B and D, Treatment with Pam3CSK4, a TLR2/1 ligand. It had the same general effect as Kdo2-lipid A on ERα, GR, RARα, RARβ, RARγ, and VDR expression. AR, MR, TRα, and TRβ displayed a peak in expression at the 72-h time point. Basal expression at time zero (normalized to 36B4) was assigned an expression value of 100, and subsequent time points are relative to time zero. Error bars represent sd.
Fig. 6.
Fig. 6.
Basal and stimulated expression profiles of B-1 cell adopted orphan nuclear receptors A, Adopted orphan receptors in basal peritoneal B-1 cells generally display increasing levels of expression over time. PPARα expression was dynamic. B, Kdo2-lipid A enhanced the expression of PPARδ and RXRα, whereas LXRβ, PPARα, and RXRβ expression was generally unaffected. C, Pam3CSK4 induced the expression of PPARδ and RXRα, had minimal effect on LXRβ and RXRβ, and inhibited the expression of PPARα. Basal expression at time zero (normalized to 36B4) was assigned an expression value of 100, and subsequent time points are relative to time zero. Error bars represent sd.
Fig. 7.
Fig. 7.
Stimulated expression profiles of B-2 cell adopted orphan nuclear receptors. A, Treatment with Kdo2-lipid A. Adopted orphan receptors in stimulated peritoneal B-2 cells displayed decreasing expression levels of LXRβ, RXRα, and RXRβ, whereas PPARα expression was increased and PPARδ expression was unaffected. B, Pam3CSK4 treatment had the same general effect as Kdo2-lipid A on all nuclear receptors except PPARδ, which displayed dynamic expression. Basal expression at time zero (normalized to 36B4) was assigned an expression value of 100, and subsequent time points are relative to time zero. Error bars represent sd.
Fig. 8.
Fig. 8.
Basal and stimulated expression profiles of B-1 cell orphan nuclear receptors. A, Orphan receptors activators in basal peritoneal B-1 cells generally display dynamic expression. LRH-1 and NOR-1 increased expression over time. NGF1-β and NURR-1 had dramatically increased expression at 6 h followed by decreasing expression. ERR-1 expression had minimal change over time. B, Kdo2-lipid A caused modest down-regulation of ERR-1 expression and induced expression of LRH-1. It strongly induced expression of NGF1-β, NOR-1, and NURR-1 at 6 h followed by decreasing expression. C, Pam3CSK4 induced many of the same general effects as Kdo2-lipid A on the expression of ERR-1, NGF1-β, and NOR-1. LRH-1 expression was only strongly induced at the 6-h time point, and induction of NURR-1 was delayed until the 24-h time point. D, Orphan receptors repressors in basal peritoneal B-1 cells generally display increasing expression over time, Reverb-α expression peaked at 6 h and decreased thereafter. E, Kdo2-Lipid A inhibited Rev-erb-α and Rev-erb-β expression at later time points and had minimal effect on TR2 and TR4 expression. F, Pam3CSK4 induced many of the same general effects as Kdo2-lipid A on the expression of Rev-erb-α, Rev-erb-β, TR2, and TR4. Basal expression at time zero (normalized to 36B4) was assigned an expression value of 100, and subsequent time points are relative to time zero. Error bars represent sd.
Fig. 9.
Fig. 9.
Stimulated expression profiles of B-2 cell orphan nuclear receptors. A and C, Treatment with Kdo2-lipid A. Orphan receptors in stimulated peritoneal B-2 cells displayed dynamic expression. ERR-1, Rev-erb-α, Rev-erb-β, RORβ, TR2, and TR4 displayed decreasing levels of expression over time. LRH-1, NGF1-β, NOR-1, and NURR-1 showed peaks of expression at subsequent time points. B and D, Treatment with Pam3CSK4 induced many of the same general effects as Kdo2-lipid A on the expression of most of the orphan nuclear receptors. LRH-1 expression was not induced at the 24-h time point, and NURR-1 expression did not peak at 72 h. Basal expression at time zero (normalized to 36B4) was assigned an expression value of 100, and subsequent time points are relative to time zero. Error bars represent sd.

Similar articles

Cited by

References

    1. Martin F, Kearney JF. 2000. B-cell subsets and the mature preimmune repertoire. Marginal zone and B1 B cells as part of a “natural immune memory.” Immunol Rev 175:70–79 - PubMed
    1. Baumgarth N, Tung JW, Herzenberg LA. 2005. Inherent specificities in natural antibodies: a key to immune defense against pathogen invasion. Springer Semin Immunopathol 26:347–362 - PubMed
    1. Shaw PX, Hörkkö S, Chang MK, Curtiss LK, Palinski W, Silverman GJ, Witztum JL. 2000. Natural antibodies with the T15 idiotype may act in atherosclerosis, apoptotic clearance, and protective immunity. J Clin Invest 105:1731–1740 - PMC - PubMed
    1. Bouaziz JD, Yanaba K, Tedder TF. 2008. Regulatory B cells as inhibitors of immune responses and inflammation. Immunol Rev 224:201–214 - PubMed
    1. Hayakawa K, Hardy RR, Parks DR, Herzenberg LA. 1983. The Ly-1 B-cell subpopulation in normal, immunodefective, and autoimmune mice. J Exp Med 157:202–218 - PMC - PubMed

Publication types

MeSH terms