Review
. 2011 Feb;258(2):351-69.
doi: 10.1148/radiol.10081634.

Principles of and advances in percutaneous ablation

Affiliations
Review

Principles of and advances in percutaneous ablation

Muneeb Ahmed et al. Radiology. 2011 Feb.

Abstract

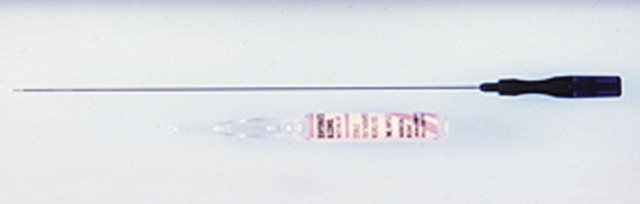
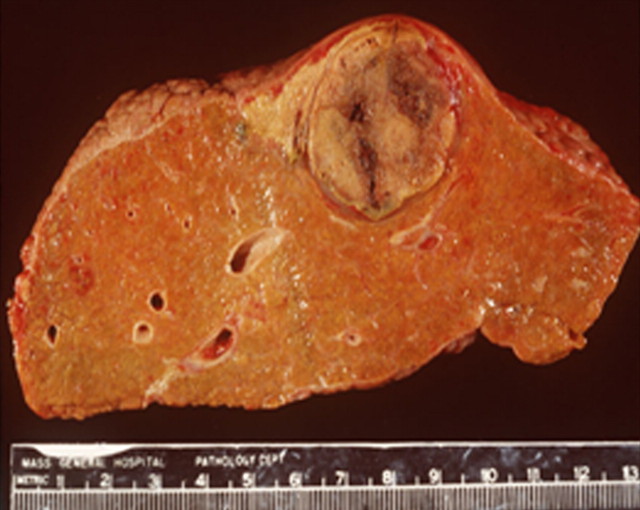
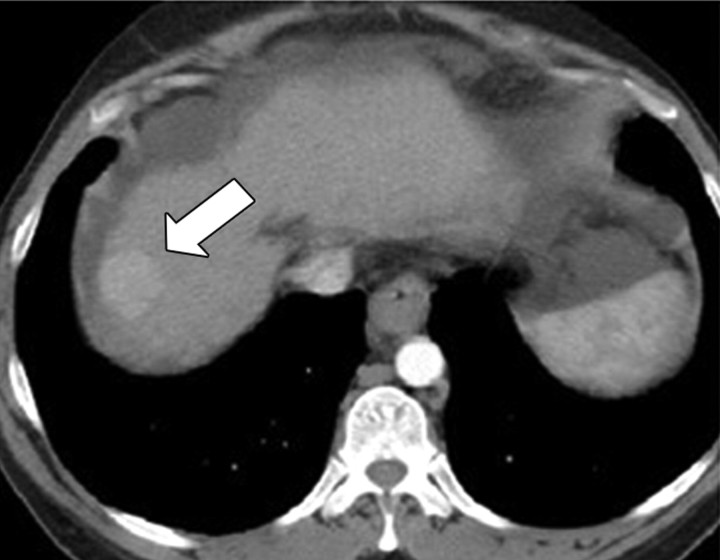
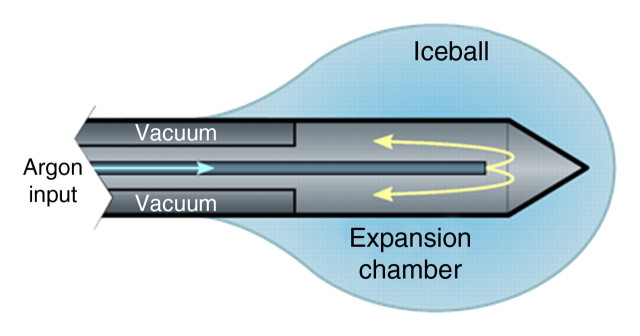
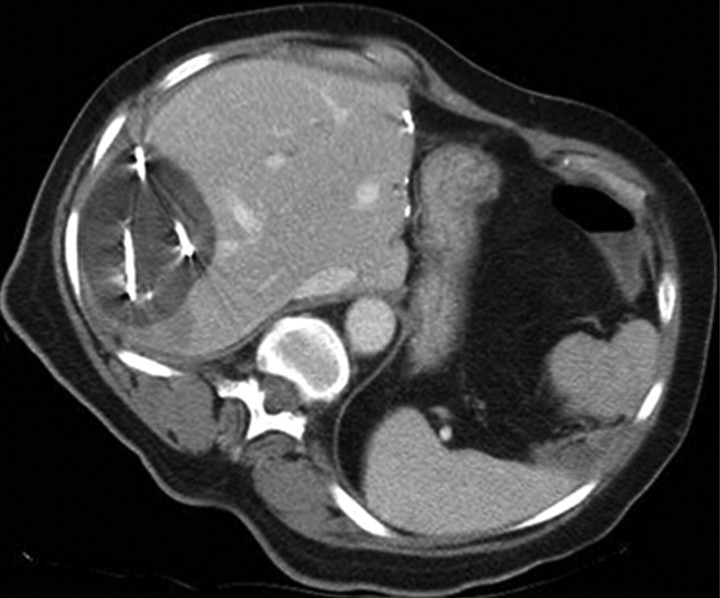
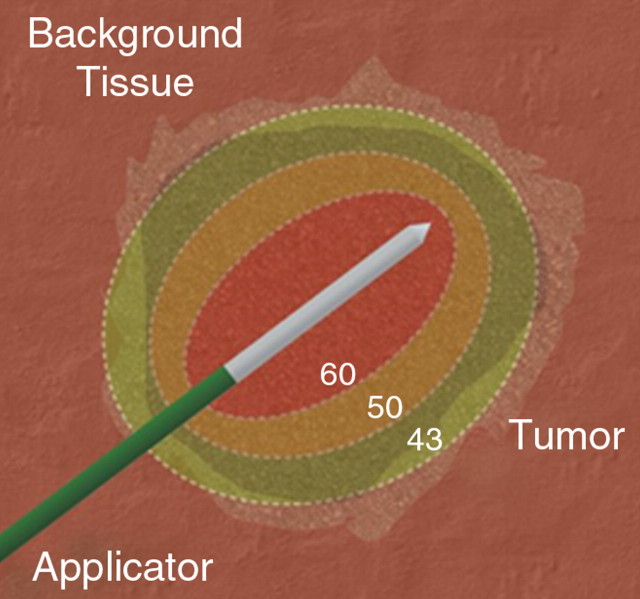
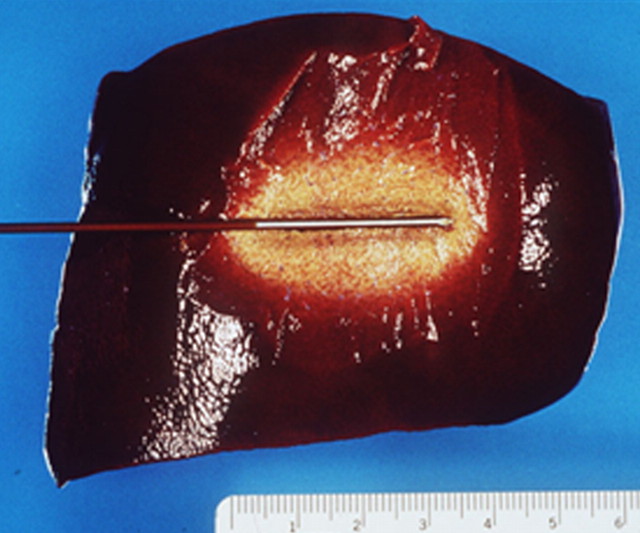
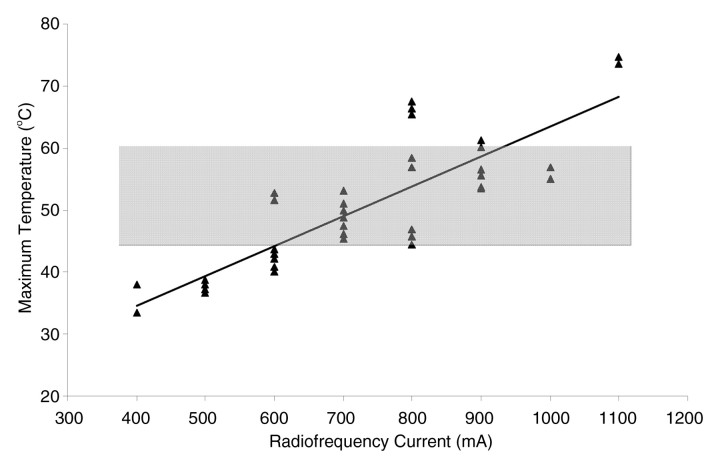
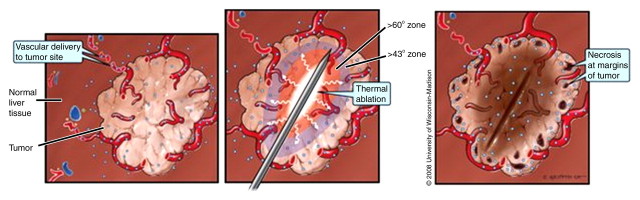
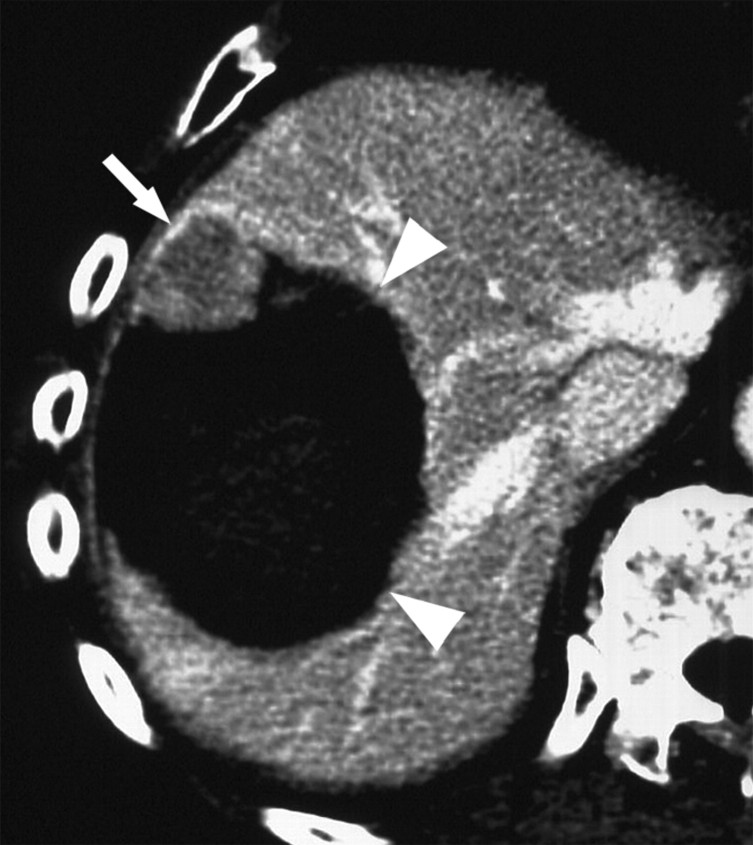
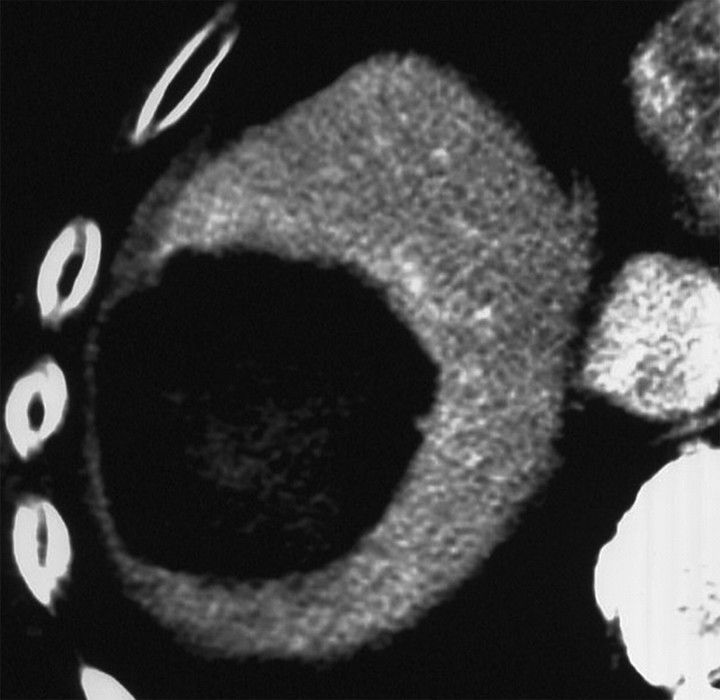
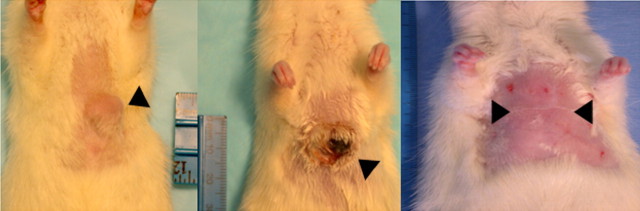
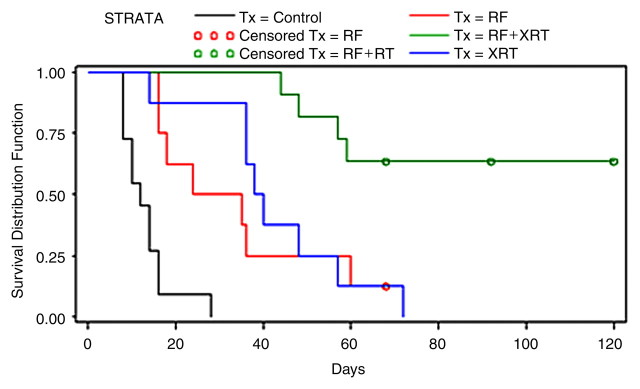
Image-guided tumor ablation with both thermal and nonthermal sources has received substantial attention for the treatment of many focal malignancies. Increasing interest has been accompanied by continual advances in energy delivery, application technique, and therapeutic combinations with the intent to improve the efficacy and/or specificity of ablative therapies. This review outlines clinical percutaneous tumor ablation technology, detailing the science, devices, techniques, technical obstacles, current trends, and future goals in percutaneous tumor ablation. Methods such as chemical ablation, cryoablation, high-temperature ablation (radiofrequency, microwave, laser, and ultrasound), and irreversible electroporation will be discussed. Advances in technique will also be covered, including combination therapies, tissue property modulation, and the role of computer modeling for treatment optimization.


Figures

Figure 1a:
Figure 1a:
(a) For ethanol ablation, a 21-gauge needle is used to inject ethanol into the tumor after placement with ultrasonographic or computed tomographic (CT) guidance. (b) Gross pathologic cross-section shows gross effects of ethanol instillation in a primary hepatic tumor. (c) Pretreatment contrast agent–enhanced axial CT image shows a focal hepatocellular carcinoma (arrow) in the right hepatic lobe, and (d) CT image obtained 3 months after ethanol instillation shows focal tumor necrosis with minimal peripheral enchancement (arrow).
Figure 1b:
Figure 1b:
(a) For ethanol ablation, a 21-gauge needle is used to inject ethanol into the tumor after placement with ultrasonographic or computed tomographic (CT) guidance. (b) Gross pathologic cross-section shows gross effects of ethanol instillation in a primary hepatic tumor. (c) Pretreatment contrast agent–enhanced axial CT image shows a focal hepatocellular carcinoma (arrow) in the right hepatic lobe, and (d) CT image obtained 3 months after ethanol instillation shows focal tumor necrosis with minimal peripheral enchancement (arrow).
Figure 1c:
Figure 1c:
(a) For ethanol ablation, a 21-gauge needle is used to inject ethanol into the tumor after placement with ultrasonographic or computed tomographic (CT) guidance. (b) Gross pathologic cross-section shows gross effects of ethanol instillation in a primary hepatic tumor. (c) Pretreatment contrast agent–enhanced axial CT image shows a focal hepatocellular carcinoma (arrow) in the right hepatic lobe, and (d) CT image obtained 3 months after ethanol instillation shows focal tumor necrosis with minimal peripheral enchancement (arrow).
Figure 1d:
Figure 1d:
(a) For ethanol ablation, a 21-gauge needle is used to inject ethanol into the tumor after placement with ultrasonographic or computed tomographic (CT) guidance. (b) Gross pathologic cross-section shows gross effects of ethanol instillation in a primary hepatic tumor. (c) Pretreatment contrast agent–enhanced axial CT image shows a focal hepatocellular carcinoma (arrow) in the right hepatic lobe, and (d) CT image obtained 3 months after ethanol instillation shows focal tumor necrosis with minimal peripheral enchancement (arrow).
Figure 2a:
Figure 2a:
(a) Schematic illustration of a cryoprobe tip with surrounding iceball formation. (b) Axial contrast-enhanced CT image shows iceball formation during cryoablation of a hepatic tumor in the right lobe by using multiple cryoprobes.
Figure 2b:
Figure 2b:
(a) Schematic illustration of a cryoprobe tip with surrounding iceball formation. (b) Axial contrast-enhanced CT image shows iceball formation during cryoablation of a hepatic tumor in the right lobe by using multiple cryoprobes.
Figure 3a:
Figure 3a:
(a) Schematic and (b) gross specimen show focal thermal ablation. Electrode applicators are positioned in the tumor with image guidance or direct visualization. A central zone of high temperatures (greater than 60°C, can exceed 100°C) is created in tissue immediately around the electrode, and it is surrounded by more peripheral zones of sublethal tissue heating (43°–50°C) and background liver parenchyma.
Figure 3b:
Figure 3b:
(a) Schematic and (b) gross specimen show focal thermal ablation. Electrode applicators are positioned in the tumor with image guidance or direct visualization. A central zone of high temperatures (greater than 60°C, can exceed 100°C) is created in tissue immediately around the electrode, and it is surrounded by more peripheral zones of sublethal tissue heating (43°–50°C) and background liver parenchyma.
Figure 4:
Figure 4:
Graph of maximum temperature at ablation zone margin shows wider than expected variation, ranging from 33° to 76°C (56). Temperatures were monitored at 10–25 mm from the 2-cm internally cooled electrode during RF ablation (500 kHz generator; current, 400–1100 mA varied in 100-mA intervals) of a fixed coagulation diameter in ex vivo bovine liver. Gray band = previously reported maximum range.
Figure 5a:
Figure 5a:
Images of various commonly used and commercially available RF electrode designs. (a) Single internally cooled electrode with a 3-cm active tip (Cool-tip system). (b) Cluster internally cooled electrode system with three 2.5-cm active tips (Cluster electrode system; Valleylab). Two variations of an expandable electrode system: (c) StarBurst (RITA/AngioDynamics, Fremont, Calif) and (d) LeVeen (Boston Scientific, Natick, Mass).
Figure 5b:
Figure 5b:
Images of various commonly used and commercially available RF electrode designs. (a) Single internally cooled electrode with a 3-cm active tip (Cool-tip system). (b) Cluster internally cooled electrode system with three 2.5-cm active tips (Cluster electrode system; Valleylab). Two variations of an expandable electrode system: (c) StarBurst (RITA/AngioDynamics, Fremont, Calif) and (d) LeVeen (Boston Scientific, Natick, Mass).
Figure 5c:
Figure 5c:
Images of various commonly used and commercially available RF electrode designs. (a) Single internally cooled electrode with a 3-cm active tip (Cool-tip system). (b) Cluster internally cooled electrode system with three 2.5-cm active tips (Cluster electrode system; Valleylab). Two variations of an expandable electrode system: (c) StarBurst (RITA/AngioDynamics, Fremont, Calif) and (d) LeVeen (Boston Scientific, Natick, Mass).
Figure 5d:
Figure 5d:
Images of various commonly used and commercially available RF electrode designs. (a) Single internally cooled electrode with a 3-cm active tip (Cool-tip system). (b) Cluster internally cooled electrode system with three 2.5-cm active tips (Cluster electrode system; Valleylab). Two variations of an expandable electrode system: (c) StarBurst (RITA/AngioDynamics, Fremont, Calif) and (d) LeVeen (Boston Scientific, Natick, Mass).
Figure 6:
Figure 6:
Images show electric field patterns surrounding three microwave antenna designs with associated antenna size and power-application efficiency: triaxial, single slot (Slotted), and choked dipole (Choked). Energy distribution, in volts per meter, is color coded for simulations at 2.45 GHz and 50-W input power in normal liver tissue. Images show the balance between antenna size, efficiency, and heating pattern. For example, heating can be localized to the distal antenna tip by adding a choke coil at the expense of increased invasiveness (9–10 gauge, which is not suitable for percutaneous application). Thinner antennas can also be created but typically sacrifice efficiency (see slotted design). (Reprinted, with permission, from reference .)
Figure 7a:
Figure 7a:
Images of (a) laser ablation diffuser tip and (b) shaft with cooling. Laser energy is passed through an optical fiber, which may be cooled along its length to prevent heating proximal to the target zone. Diffuser tip (pink line in a) scatters light into a larger volume of tissue than an end-fire catheter to create larger and more uniform zones of ablation. (Images courtesy of Thomas Vogl, MD, University Hospital Frankfurt, Johann Wolfgang Goethe University, Frankfurt, Germany.)
Figure 7b:
Figure 7b:
Images of (a) laser ablation diffuser tip and (b) shaft with cooling. Laser energy is passed through an optical fiber, which may be cooled along its length to prevent heating proximal to the target zone. Diffuser tip (pink line in a) scatters light into a larger volume of tissue than an end-fire catheter to create larger and more uniform zones of ablation. (Images courtesy of Thomas Vogl, MD, University Hospital Frankfurt, Johann Wolfgang Goethe University, Frankfurt, Germany.)
Figure 8a:
Figure 8a:
(a) Monopolar IRE applicator and (b) bipolar IRE applicator with gross specimen of IRE ablation zone. Monopolar applicators create an electric field between pairs of electrodes, requiring multiple electrodes to be inserted. Bipolar applicators create an electric field between the two coaxial electrode sections. Gross specimen shows that there is no heat-sink effect in the IRE ablation zone, as coagulation extends up to and around the vessel lumen (arrows). (Images courtesy of William Hamilton, AngioDynamics.)
Figure 8b:
Figure 8b:
(a) Monopolar IRE applicator and (b) bipolar IRE applicator with gross specimen of IRE ablation zone. Monopolar applicators create an electric field between pairs of electrodes, requiring multiple electrodes to be inserted. Bipolar applicators create an electric field between the two coaxial electrode sections. Gross specimen shows that there is no heat-sink effect in the IRE ablation zone, as coagulation extends up to and around the vessel lumen (arrows). (Images courtesy of William Hamilton, AngioDynamics.)
Figure 9a:
Figure 9a:
Images show effect of blood flow on RF ablation size. (a) Gross bovine liver specimen shows how the heat-sink effect from a large hepatic vein (arrow) results in an incomplete zone of coagulation after in vivo RF ablation (3-cm single internally cooled electrode, 12-minute RF application). (b) Contrast-enhanced axial CT image shows how mechanical occlusion (ie, intraoperative portal vein occlusion with the Pringle maneuver) can increase RF coagulation size (upper ablation zone) by reducing the cooling effects of tissue perfusion as compared with the adjacent smaller ablation zone (arrow) that was obtained without the Pringle maneuver. (Part b reprinted, with permission, from reference .)
Figure 9b:
Figure 9b:
Images show effect of blood flow on RF ablation size. (a) Gross bovine liver specimen shows how the heat-sink effect from a large hepatic vein (arrow) results in an incomplete zone of coagulation after in vivo RF ablation (3-cm single internally cooled electrode, 12-minute RF application). (b) Contrast-enhanced axial CT image shows how mechanical occlusion (ie, intraoperative portal vein occlusion with the Pringle maneuver) can increase RF coagulation size (upper ablation zone) by reducing the cooling effects of tissue perfusion as compared with the adjacent smaller ablation zone (arrow) that was obtained without the Pringle maneuver. (Part b reprinted, with permission, from reference .)
Figure 10a:
Figure 10a:
Gross specimens show increases in RF-induced coagulation (arrows) when combined with pharmacologic modulation of tissue and tumor blood flow versus RF ablation alone. (a) Rabbit kidneys show increased coagulation (arrows) when arsenic trioxide, which has known antivascular effects, is combined with RF ablation (right) versus RF ablation alone (left). (Reprinted, with permission, from reference .) (b) Mouse tumor model shows increased tumor coagulation zones (9 mm vs 4 mm; arrows) when sorafenib, a vascular endothelial growth factor receptor inhibitor, is combined with RF ablation (right) versus RF ablation alone (left). (Reprinted, with permission, from reference .)
Figure 10b:
Figure 10b:
Gross specimens show increases in RF-induced coagulation (arrows) when combined with pharmacologic modulation of tissue and tumor blood flow versus RF ablation alone. (a) Rabbit kidneys show increased coagulation (arrows) when arsenic trioxide, which has known antivascular effects, is combined with RF ablation (right) versus RF ablation alone (left). (Reprinted, with permission, from reference .) (b) Mouse tumor model shows increased tumor coagulation zones (9 mm vs 4 mm; arrows) when sorafenib, a vascular endothelial growth factor receptor inhibitor, is combined with RF ablation (right) versus RF ablation alone (left). (Reprinted, with permission, from reference .)
Figure 11a:
Figure 11a:
Gross specimens show modulation of intratumoral electrical conductivity with adjuvant NaCl injection around the RF electrode increases RF-induced (1-cm single internally cooled electrode, 12-minute RF ablation) tissue coagulation in a subcutaneously implanted canine venereal sarcoma tumor model. (a) Tumor treated with RF ablation alone shows a 3.2-cm central focus of coagulation (large arrow) surrounded by marked hyperemia. Evans Blue, a marker for vascular perfusion, intensely stains the peripheral subcutaneous tissues and residual unablated tumor (small arrows). (b) A 5.5-cm tumor treated with RF ablation and 36% NaCl solution pretreatment shows no evidence of residual vascular perfusion. Intense hyperemia and perfusion is seen in the cutaneous and peripheral tissues (arrows). However, no evidence of mitochondrial enzyme activity or perfusion was seen in this completely ablated tumor. (Reprinted, with permission, from reference .)
Figure 11b:
Figure 11b:
Gross specimens show modulation of intratumoral electrical conductivity with adjuvant NaCl injection around the RF electrode increases RF-induced (1-cm single internally cooled electrode, 12-minute RF ablation) tissue coagulation in a subcutaneously implanted canine venereal sarcoma tumor model. (a) Tumor treated with RF ablation alone shows a 3.2-cm central focus of coagulation (large arrow) surrounded by marked hyperemia. Evans Blue, a marker for vascular perfusion, intensely stains the peripheral subcutaneous tissues and residual unablated tumor (small arrows). (b) A 5.5-cm tumor treated with RF ablation and 36% NaCl solution pretreatment shows no evidence of residual vascular perfusion. Intense hyperemia and perfusion is seen in the cutaneous and peripheral tissues (arrows). However, no evidence of mitochondrial enzyme activity or perfusion was seen in this completely ablated tumor. (Reprinted, with permission, from reference .)
Figure 12:
Figure 12:
Illustrations show method for combining thermal ablation with targeted drug delivery. Left: Drugs are brought to the tumor site as part of normal circulation. Middle: Temperature elevations inside the ablation zone facilitate local drug release, which then accumulates in the sublethal region at the periphery of the ablation zone. Right: Net result is a larger zone of ablation than would be possible with ablation alone. (Printed with permission from the University of Wisconsin–Madison.)
Figure 13a:
Figure 13a:
Images show results of combination RF ablation and intravenous liposomal doxorubicin. (a) Autoradiographs of two paired tumors from the same animal 24 hours after intravenous administration of tritiated liposomes. Left: Without RF ablation. Right: With RF ablation immediately preceding liposome injection, the central zone with little uptake corresponds to the zone of RF coagulation, with a peripheral rim of increased liposome uptake (arrows). (Reprinted, with permission, from reference .) (b) Gross specimens of subcutaneous canine venereal sarcoma tumors. Right: RF ablation (12-minute application, 1-cm internally cooled electrode) combined with intravenous liposomal doxorubicin (RF + Doxil). Left: RF ablation (RF alone). In the tumor that underwent combined therapy, the central white zone (arrows) that corresponds to RF-induced coagulation is slightly (3-mm) larger and the peripheral red zone (arrowheads), which is frank coagulative necrosis, is dramatically increased in size (1.6 cm vs 0.7 cm). (Reprinted, with permission, from reference .)
Figure 13b:
Figure 13b:
Images show results of combination RF ablation and intravenous liposomal doxorubicin. (a) Autoradiographs of two paired tumors from the same animal 24 hours after intravenous administration of tritiated liposomes. Left: Without RF ablation. Right: With RF ablation immediately preceding liposome injection, the central zone with little uptake corresponds to the zone of RF coagulation, with a peripheral rim of increased liposome uptake (arrows). (Reprinted, with permission, from reference .) (b) Gross specimens of subcutaneous canine venereal sarcoma tumors. Right: RF ablation (12-minute application, 1-cm internally cooled electrode) combined with intravenous liposomal doxorubicin (RF + Doxil). Left: RF ablation (RF alone). In the tumor that underwent combined therapy, the central white zone (arrows) that corresponds to RF-induced coagulation is slightly (3-mm) larger and the peripheral red zone (arrowheads), which is frank coagulative necrosis, is dramatically increased in size (1.6 cm vs 0.7 cm). (Reprinted, with permission, from reference .)
Figure 14a:
Figure 14a:
CT images show increased tumor destruction with combined RF ablation and liposomal doxorubicin in an 82-year-old man with an 8.2-cm vascular hepatoma. (a) Image obtained immediately after RF ablation shows persistent regions of residual untreated tumor (arrows). (b) Image at 2-week follow-up shows interval increase in coagulation as the 1.5-cm inferior region of residual tumor and the 1.2-cm anteromedial portion of the tumor no longer enhance (arrowheads). A persistent nodule of viable tumor is shown (arrow), which was successfully treated with another course of RF ablation. (c) Image obtained immediately after RF ablation shows the persistence of a large vessel (arrows) in the nonenhancing ablated lesion. (d) Image at 2-week follow-up shows no enhancement in this region, and no vessel was seen on any of the three phases of contrast enhancement. No evidence of local tumor recurrence was identified at 48-month follow-up. (Reprinted, with permission, from reference .)
Figure 14b:
Figure 14b:
CT images show increased tumor destruction with combined RF ablation and liposomal doxorubicin in an 82-year-old man with an 8.2-cm vascular hepatoma. (a) Image obtained immediately after RF ablation shows persistent regions of residual untreated tumor (arrows). (b) Image at 2-week follow-up shows interval increase in coagulation as the 1.5-cm inferior region of residual tumor and the 1.2-cm anteromedial portion of the tumor no longer enhance (arrowheads). A persistent nodule of viable tumor is shown (arrow), which was successfully treated with another course of RF ablation. (c) Image obtained immediately after RF ablation shows the persistence of a large vessel (arrows) in the nonenhancing ablated lesion. (d) Image at 2-week follow-up shows no enhancement in this region, and no vessel was seen on any of the three phases of contrast enhancement. No evidence of local tumor recurrence was identified at 48-month follow-up. (Reprinted, with permission, from reference .)
Figure 14c:
Figure 14c:
CT images show increased tumor destruction with combined RF ablation and liposomal doxorubicin in an 82-year-old man with an 8.2-cm vascular hepatoma. (a) Image obtained immediately after RF ablation shows persistent regions of residual untreated tumor (arrows). (b) Image at 2-week follow-up shows interval increase in coagulation as the 1.5-cm inferior region of residual tumor and the 1.2-cm anteromedial portion of the tumor no longer enhance (arrowheads). A persistent nodule of viable tumor is shown (arrow), which was successfully treated with another course of RF ablation. (c) Image obtained immediately after RF ablation shows the persistence of a large vessel (arrows) in the nonenhancing ablated lesion. (d) Image at 2-week follow-up shows no enhancement in this region, and no vessel was seen on any of the three phases of contrast enhancement. No evidence of local tumor recurrence was identified at 48-month follow-up. (Reprinted, with permission, from reference .)
Figure 14d:
Figure 14d:
CT images show increased tumor destruction with combined RF ablation and liposomal doxorubicin in an 82-year-old man with an 8.2-cm vascular hepatoma. (a) Image obtained immediately after RF ablation shows persistent regions of residual untreated tumor (arrows). (b) Image at 2-week follow-up shows interval increase in coagulation as the 1.5-cm inferior region of residual tumor and the 1.2-cm anteromedial portion of the tumor no longer enhance (arrowheads). A persistent nodule of viable tumor is shown (arrow), which was successfully treated with another course of RF ablation. (c) Image obtained immediately after RF ablation shows the persistence of a large vessel (arrows) in the nonenhancing ablated lesion. (d) Image at 2-week follow-up shows no enhancement in this region, and no vessel was seen on any of the three phases of contrast enhancement. No evidence of local tumor recurrence was identified at 48-month follow-up. (Reprinted, with permission, from reference .)
Figure 15a:
Figure 15a:
Combining RF ablation with external beam radiation for treatment of subcutaneously implanted R3230 rat breast tumors (arrowheads). (a) Left: Before treatment. Middle: Immediately after RF ablation combined with external beam radiation. Right: At 120-day follow-up. Posttreatment images show complete tumor dissolution. (b) Kaplan-Meier analysis shows increased animal survival with combination therapy (RF + XRT) compared with RF ablation alone (RF), external beam radiation along (XRT), and no treatment (Control). Tx = treatment. (Reprinted, with permission, from reference .)
Figure 15b:
Figure 15b:
Combining RF ablation with external beam radiation for treatment of subcutaneously implanted R3230 rat breast tumors (arrowheads). (a) Left: Before treatment. Middle: Immediately after RF ablation combined with external beam radiation. Right: At 120-day follow-up. Posttreatment images show complete tumor dissolution. (b) Kaplan-Meier analysis shows increased animal survival with combination therapy (RF + XRT) compared with RF ablation alone (RF), external beam radiation along (XRT), and no treatment (Control). Tx = treatment. (Reprinted, with permission, from reference .)

References

    1. Solbiati L, Ierace T, Cova L, Zaid S, Imparato S. Ten-year experience in nonsurgical treatment of “intermediate” hepatocellular carcinoma in cirrhotic patients: long-term survival and causes of death [abstr]. In: Radiological Society of North America scientific assembly and annual meeting program. Oak Brook, Ill: Radiological Society of North America, 2006;359.
    1. Livraghi T, Solbiati L, Meloni MF, Gazelle GS, Halpern EF, Goldberg SN. Treatment of focal liver tumors with percutaneous radio-frequency ablation: complications encountered in a multicenter study. Radiology 2003;226(2):441–451. - PubMed
    1. Gillams AR, Lees WR. Five-year survival following radiofrequency ablation of small, solitary, hepatic colorectal metastases. J Vasc Interv Radiol 2008;19(5):712–717. - PubMed
    1. Gervais DA, McGovern FJ, Arellano RS, McDougal WS, Mueller PR. Renal cell carcinoma: clinical experience and technical success with radio-frequency ablation of 42 tumors. Radiology 2003;226(2):417–424. - PubMed
    1. Dupuy DE, DiPetrillo T, Gandhi S, et al. . Radiofrequency ablation followed by conventional radiotherapy for medically inoperable stage I non-small cell lung cancer. Chest 2006;129(3):738–745. - PubMed

MeSH terms

LinkOut - more resources