Review
. 2011 Jan;8(1):39-53.
doi: 10.1007/s13311-010-0003-3.

Imaging for the diagnosis and management of traumatic brain injury

Affiliations
Review

Imaging for the diagnosis and management of traumatic brain injury

Jane J Kim et al. Neurotherapeutics. 2011 Jan.

Abstract

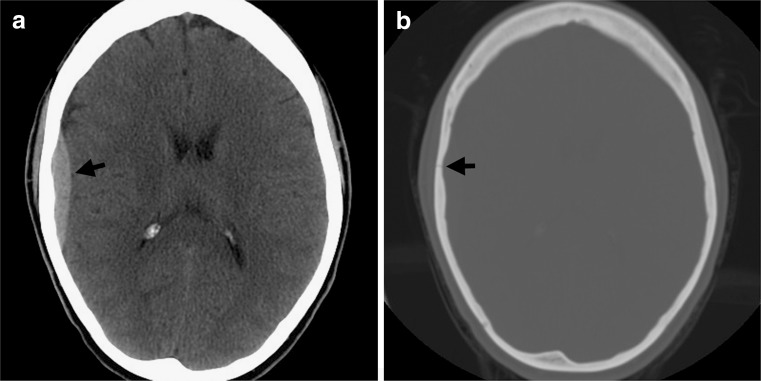
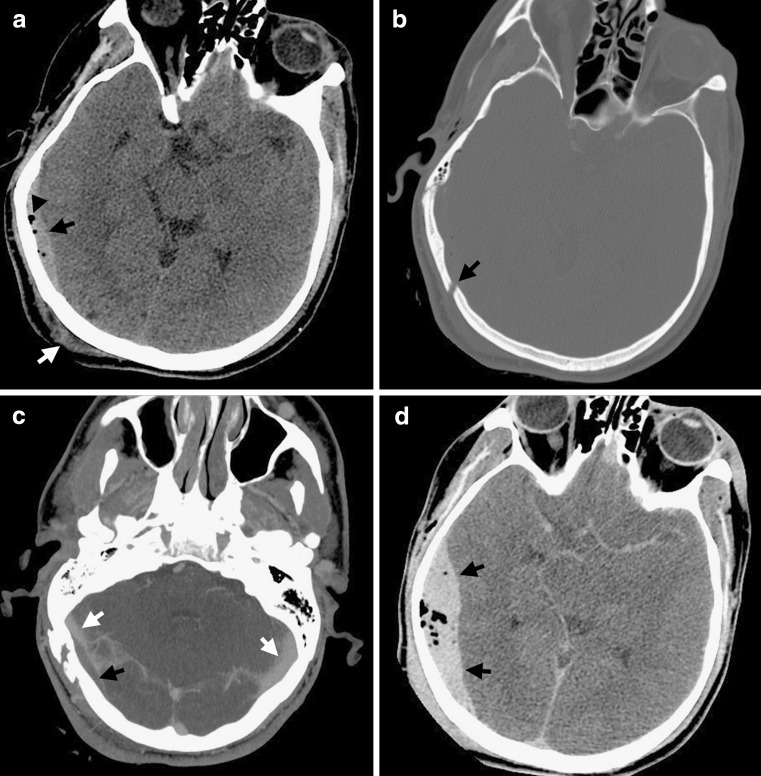
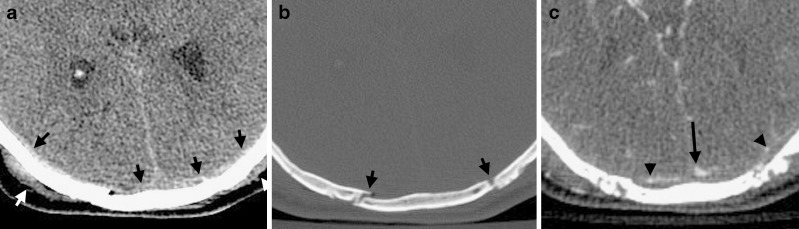
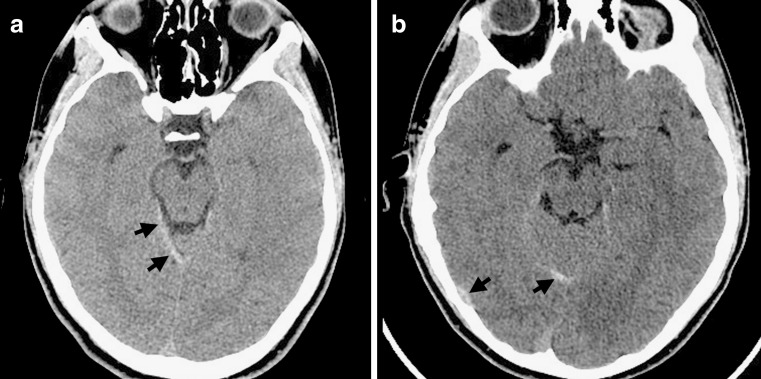
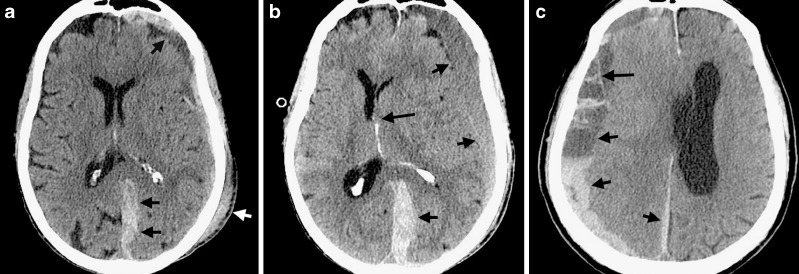
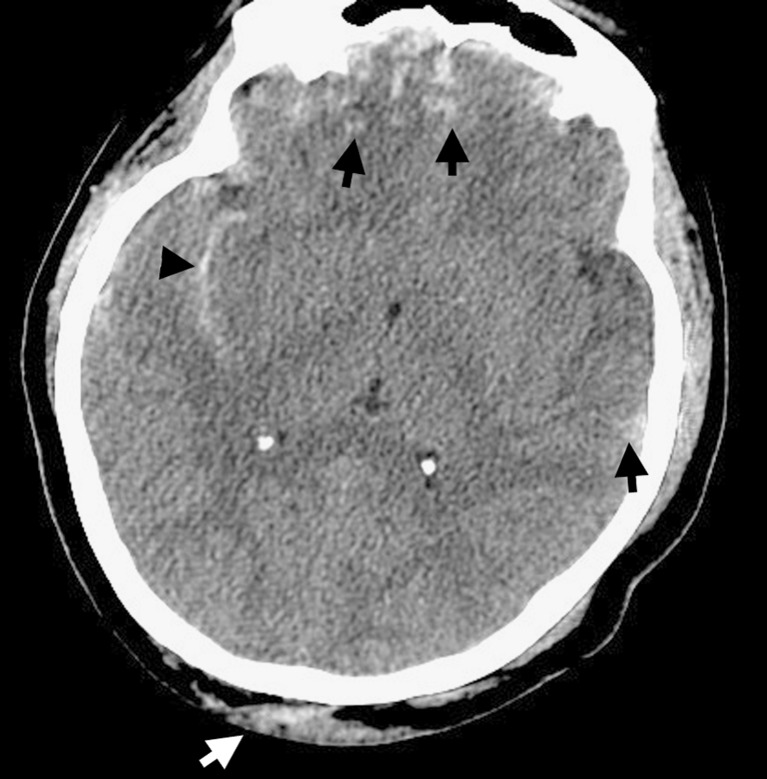
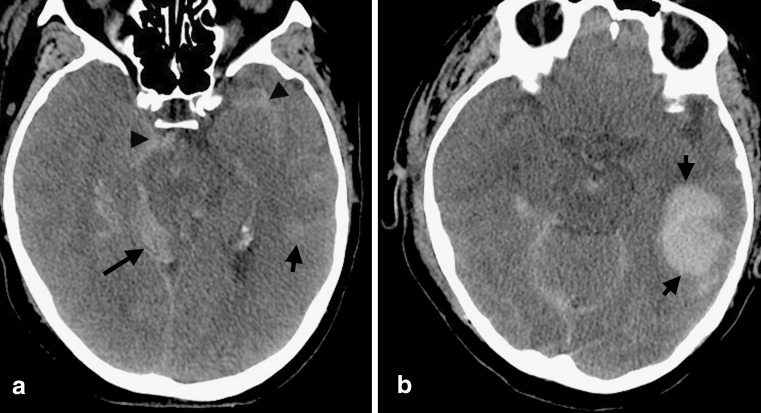
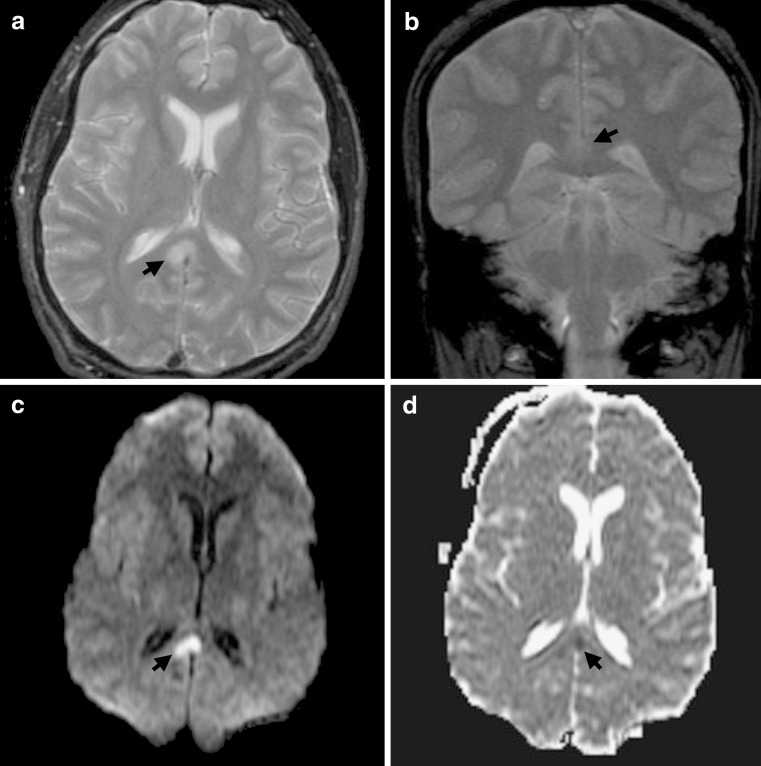
To understand the role of imaging in traumatic brain injury (TBI), it is important to appreciate that TBI encompasses a heterogeneous group of intracranial injuries and includes both insults at the time of impact and a deleterious secondary cascade of insults that require optimal medical and surgical management. Initial imaging identifies the acute primary insult that is essential to diagnosing TBI, but serial imaging surveillance is also critical to identifying secondary injuries such as cerebral herniation and swelling that guide neurocritical management. Computed tomography (CT) is the mainstay of TBI imaging in the acute setting, but magnetic resonance tomography (MRI) has better diagnostic sensitivity for nonhemorrhagic contusions and shear-strain injuries. Both CT and MRI can be used to prognosticate clinical outcome, and there is particular interest in advanced applications of both techniques that may greatly improve the sensitivity of conventional CT and MRI for both the diagnosis and prognosis of TBI.


Figures

FIG. 1
FIG. 1
Classic arterial epidural hematoma. (a) Axial noncontrast CT in brain windows shows a lentiform, high attenuation collection (arrow) adjacent to the right temporal lobe, consistent with an EDH caused by injury to a branch of the middle meningeal artery. (b) The skull fracture that is almost invariably seen with an EDH is best appreciated on bone windows (arrow). CT = computed tomography; EDH = epidural hematoma. (High resolution version of this image is available in the electronic supplementary material.)
FIG. 2
FIG. 2
Venous epidural hematoma. (a) This patient sustained a blow to the back of his right occiput (coup site), as indicated by scalp soft tissue swelling (white arrow). Underlying the coup site is a lentiform EDH (black arrow). Several foci of pneumocephalus are noted (arrowhead) that indicate an associated skull fracture. (b) The displaced skull fracture (black arrow) is best seen on bone windows. (c) Contrast-enhanced CT venogram was obtained as the fracture line extended over the expected location of the right transverse sinus. The opacified transverse sinuses (white arrows) are patent, but the right transverse sinus is compressed and displaced from the inner table of the skull by the EDH (black arrow) caused by injury to the transverse sinus. Note that EDHs form superficial to the periosteal dural layer vesting the outer margin of the venous sinus, thereby possibly displacing the venous sinus away from the calvarium. (d) Follow-up CT 3 h after presentation shows substantial enlargement of the EDH (black arrows), which is less commonly seen with venous EDHs as compared to arterial EDHs. This was subsequently surgically evacuated. (High resolution version of this image is available in the electronic supplementary material.)
FIG. 3
FIG. 3
EDH crossing midline. (a) Underlying the coup site, as indicated by soft tissue swelling (white arrows), is a subtle, relatively thin extra-axial hematoma (black arrows). Note that this hematoma extends across the midline, which distinguishes an EDH from an SDH. (b) The associated calvarial fractures (black arrows) at the coup site are readily appreciated on bone windows. (c) The superior sagittal sinus (long arrow) is displaced from the inner table of the skull by the EDH, as are small cortical vessels (arrowheads). SDH = Subdural hematoma. (High resolution version of this image is available in the electronic supplementary material.)
FIG. 4
FIG. 4
Subtle tentorial subdural hematoma. (a) There is relatively subtle, asymmetric high density and thickening (arrows) along the right margin of the tentorial incisura as compared to the left, consistent with a very small SDH. This was the only intracranial abnormality in this young patient with minor head trauma. (b) Follow-up CT within 6 h demonstrates redistribution of the SDH, which can now be seen overlying the cerebral convexity in addition to the tentorium (arrows). (High resolution version of this image is available in the electronic supplementary material.)
FIG. 5
FIG. 5
Heterogeneous subdural hematomas. (a) This patient suffered a blow to the left side of her head (white arrow) and has a left-sided holohemispheric SDH (black arrows) that extends along the falx posteriorly. Note the heterogeneity of attenuation, with mixed high- and low-density areas that are worrisome indications of active bleeding or an underlying coagulopathy. Note also the mass effect of the SDH, which compresses the underlying brain parenchyma and causes asymmetric sulcal effacement. (b) Follow-up CT scan 8 h later shows substantial enlargement of the SDH (short arrows) as would be expected with active bleeding or coagulopathy, with a new left-to-right midline shift (long arrow). (c) Noncontrast CT scan in a different patient also shows a heterogeneous, holohemispheric SDH (short arrows). In this case, however, heterogeneity is caused by acute hemorrhage into a pre-existing chronic SDH, as indicated by fibrinous strands (long arrow), which are commonly seen with chronic SDHs. (High resolution version of this image is available in the electronic supplementary material.)
FIG. 6
FIG. 6
Hemorrhagic contusions. Following a blow to the occiput, as indicated by soft tissue swelling (white arrow), characteristic contrecoup hemorrhagic contusions are seen in the inferior frontal and temporal lobes (black arrows). Also note the SAH (arrowhead) in the right Sylvian fissure, which is a poor prognostic indicator. SAG = Subarachnoid hemorrhage. (High resolution version of this image is available in the electronic supplementary material.)
FIG. 7
FIG. 7
Blossoming of hemorrhagic contusions. (a) Multiple intracranial hemorrhages are seen in this patient, including a small, subtle left temporal hemorrhagic contusion (short arrow), SDH along the right tentorium (long arrow), and SAH in the basilar cisterns and Sylvian fissure (arrowheads). (b) Follow-up CT scan 6 h later demonstrates significant expansion of the left temporal contusion (short arrows) into an intraparenchymal hematoma, underscoring the importance of serial CT monitoring. (High resolution version of this image is available in the electronic supplementary material.)
FIG. 8
FIG. 8
Traumatic axonal injury on CT and MRI. Small foci of hemorrhagic TAI are seen in the right parasagittal posterior frontal lobe (arrow, a) and in the splenium of the corpus callosum (arrow, b). No other foci of TAI were observed on this admission CT scan. However, coronal gradient-echo images from a subsequent MRI scan obtained three days later at 1.5T demonstrate susceptibility from hemorrhagic TAI not only in the splenium (arrow, c) but also in the cerebellar hemispheres (arrowheads, c). Many other foci of TAI are seen in the basal ganglia and at the gray–white junction of both the frontal and temporal lobes (d) illustrating the superior sensitivity of MRI over to CT for TAI. MRI = Magnetic resonance imaging. (High resolution version of this image is available in the electronic supplementary material.)
FIG. 9
FIG. 9
Traumatic axonal injury on diffusion-weighted imaging. (a) Axial T2-weighted spin echo sequence demonstrates hyperintensity in the splenium of the corpus callosum (arrow), a characteristic location for TAI. (b) Coronal gradient-recall echo sequence shows hyperintensity in the splenium (arrow) but no susceptibility artifact to suggest hemorrhage. (c) and (d) The signal abnormality (arrow) is much more conspicuous on diffusion-weighted imaging (c) and has reduced diffusion on the apparent diffusion coefficient map (d) consistent with cytotoxic edema in this focus of non-hemorrhagic TAI. (High resolution version of this image is available in the electronic supplementary material.)
FIG. 10
FIG. 10
Diffuse cerebral swelling. (a) and (b) Axial noncontrast CT scans demonstrate diffuse sulcal effacement in this 32-year-old patient who sustained head trauma. Note the absence of cerebral sulci but the relative preservation of gray–white differentiation, suggesting cerebral hyperemia due to post-traumatic dysautoregulation. (High resolution version of this image is available in the electronic supplementary material.)
FIG. 11
FIG. 11
Duret hemorrhage with cerebral herniation. Large left holohemispheric and parafalcine subdural hematoma (short black arrows, a) results in midline shift (long black arrow, a) and uncal (long white arrow, b) herniation. Downward brainstem herniation has led to classic Duret hemorrhage (short white arrow, b) in the paramedian midbrain. (High resolution version of this image is available in the electronic supplementary material.)
FIG. 12
FIG. 12
Infarction as complication of cerebral herniation. Large right-sided holohemispheric subdural hematoma results in subfalcine (arrow, a) and uncal (arrow, b) herniation. Despite decompressive hemicraniectomy, the patient subsequently developed infarcts in the anterior cerebral artery (arrow, c) and posterior cerebral artery (short arrow, d) distributions due to subfalcine and uncal herniation, respectively. Note also infarction of the posterior limb of the right internal capsule (long arrow, d) which is due to compression of the anterior choroidal artery with uncal herniation. (High resolution version of this image is available in the electronic supplementary material.)

References

    1. Centers for Disease Control and Prevention. Traumatic brain injury. Available at: http://wwwcdcgov/traumaticbraininjury/statisticshtml Last modified March 17, 2010.
    1. Bratton SL, Chestnut RM, Ghajar J, et al. Guidelines for the management of severe traumatic brain injury. IX. Cerebral perfusion thresholds. J Neurotrauma. 2007;24(1):S59–S64. - PubMed
    1. Nordstrom CH, Reinstrup P, Xu W, Gardenfors A, Ungerstedt U. Assessment of the lower limit for cerebral perfusion pressure in severe head injuries by bedside monitoring of regional energy metabolism. Anesthesiology. 2003;98:809–814. doi: 10.1097/00000542-200304000-00004. - DOI - PubMed
    1. Chesnut RM, Marshall LF, Klauber MR, et al. The role of secondary brain injury in determining outcome from severe head injury. J Trauma. 1993;34:216–222. doi: 10.1097/00005373-199302000-00006. - DOI - PubMed
    1. Manley G, Knudson MM, Morabito D, Damron S, Erickson V, Pitts L. Hypotension, hypoxia, and head injury: frequency, duration, and consequences. Arch Surg. 2001;136:1118–1123. doi: 10.1001/archsurg.136.10.1118. - DOI - PubMed