

MR spectroscopy of normative premature newborns
- PMID: 21274971
- PMCID: PMC3391540
- DOI: 10.1002/jmri.22460
MR spectroscopy of normative premature newborns
Abstract
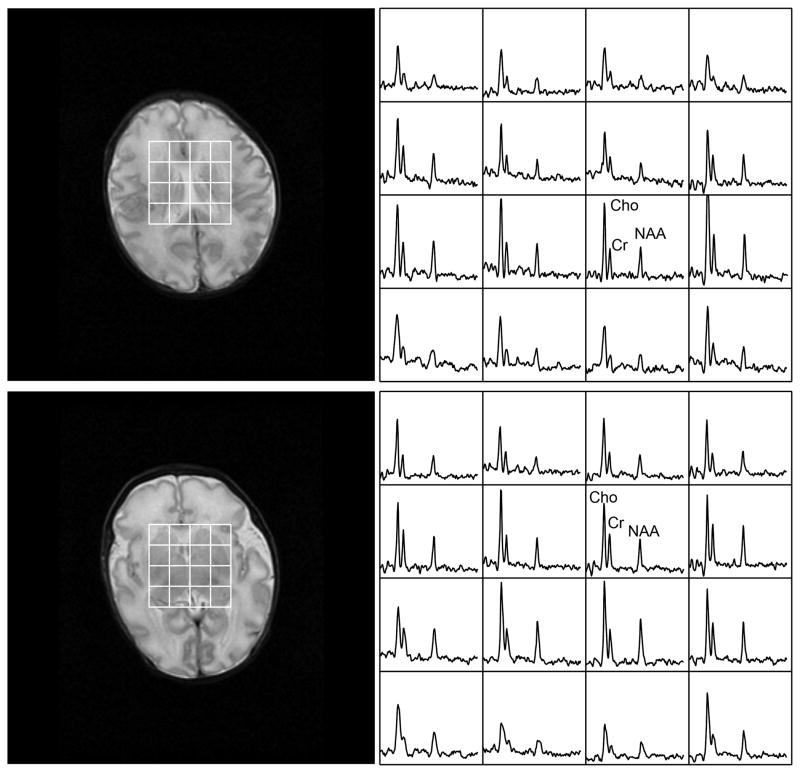
Purpose: To establish normative metabolite ratios throughout the newborn brain using three-dimensional (3D) MR spectroscopic imaging (MRSI).
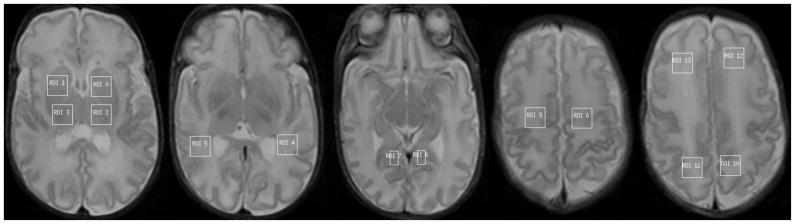
Materials and methods: MRI and MRSI have been valuable tools for assessing normal and abnormal neuronal maturation for newborns. In this study, we performed whole brain 3D MRSI in addition to comprehensive anatomic and other functional imaging methods to examine maturation. Fifty-five newborn subjects (28.4 ± 2.6 weeks postconception age at birth, 34.1 ± 3.1 weeks postconception age at scan, 32 males and 23 females) had high quality MRSI studies (104 exams) and normal neurodevelopmental outcome (neuromotor score = 0, mental development index score > 85) at age 12 months.
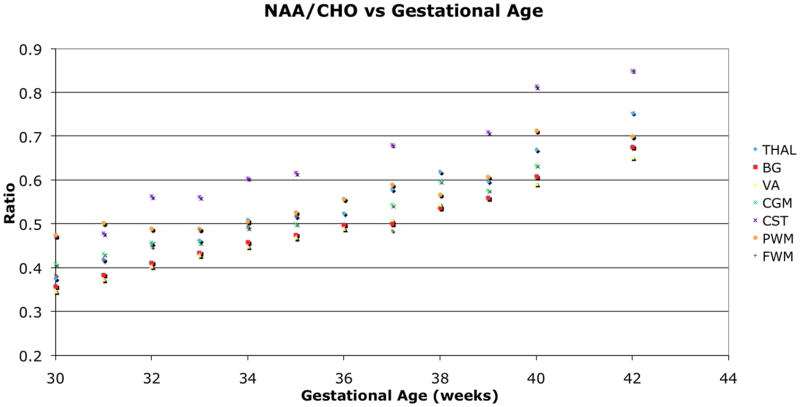
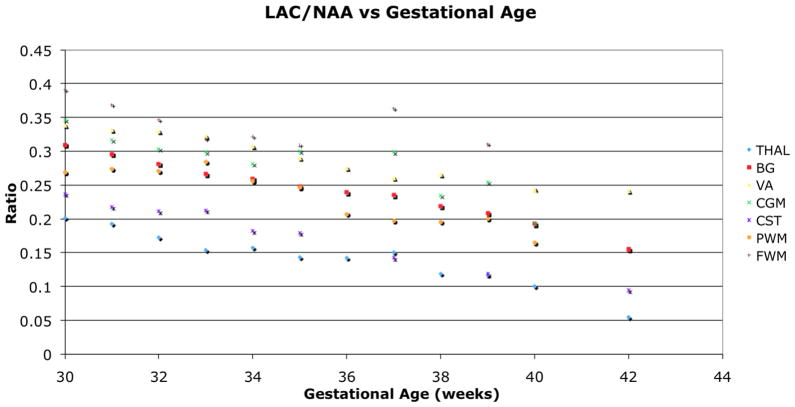
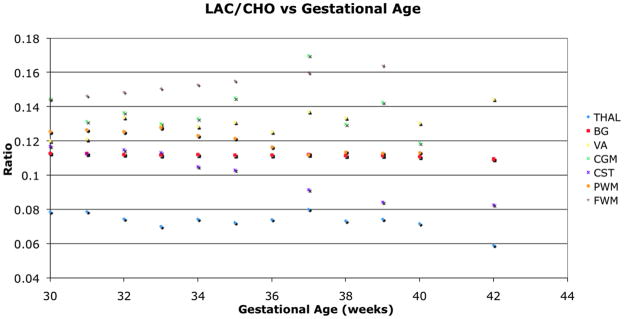
Results: The NAA to Cho ratio increased significantly with age for all regions. Lac to NAA ratio decreased significantly with age in the regions of thalamus, basal ganglia, cortical spinal tract, and parietal white matter, and showed a decreasing trend in the other regions.
Conclusion: Brain metabolites can be obtained through in vivo 3D MRSI and used to monitor newborn brain maturation.
Copyright © 2011 Wiley-Liss, Inc.
Figures
References
-
- Kimura H, Fujii Y, Itoh S, et al. Metabolic Alterations in the Neonate and Infant Brain during Development - Evaluation with Proton Mr Spectroscopy. Radiology. 1995;194(2):483–489. - PubMed
-
- Fan G, Wu Z, Chen L, Guo Q, Ye B, Mao J. Hypoxia-ischemic encephalopathy in full-term neonate: correlation proton MR spectroscopy with MR imaging. Eur J Radiol. 2003;45(2):91–98. - PubMed
-
- Miller SP, McQuillen PS, Hamrick S, et al. Abnormal brain development in newborns with congenital heart disease. N Engl J Med. 2007;357(19):1928–1938. - PubMed
-
- Cecil KM, Jones BV. Magnetic resonance spectroscopy of the pediatric brain. Top Magn Reson Imaging. 2001;12(6):435–452. - PubMed
Publication types
MeSH terms
Substances
Grants and funding
LinkOut - more resources
Full Text Sources
