. 2011 Jan 28:9:5.
doi: 10.1186/1741-7007-9-5.

Visualization of protein interactions in living Drosophila embryos by the bimolecular fluorescence complementation assay

Affiliations

Visualization of protein interactions in living Drosophila embryos by the bimolecular fluorescence complementation assay

Bruno Hudry et al. BMC Biol. .

Abstract

Background: Protein interactions control the regulatory networks underlying developmental processes. The understanding of developmental complexity will, therefore, require the characterization of protein interactions within their proper environment. The bimolecular fluorescence complementation (BiFC) technology offers this possibility as it enables the direct visualization of protein interactions in living cells. However, its potential has rarely been applied in embryos of animal model organisms and was only performed under transient protein expression levels.

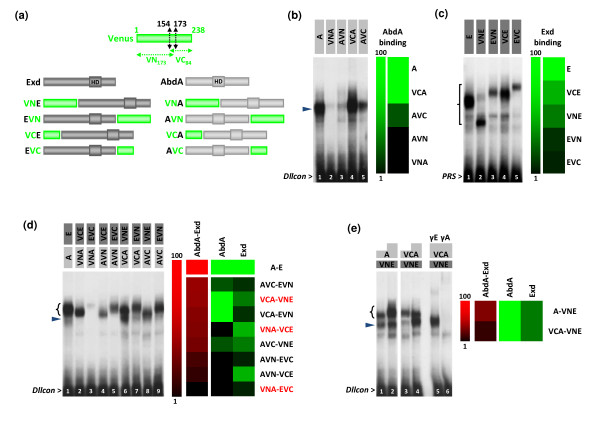
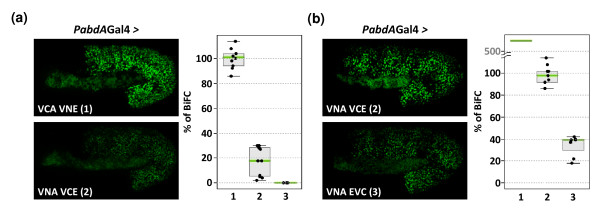
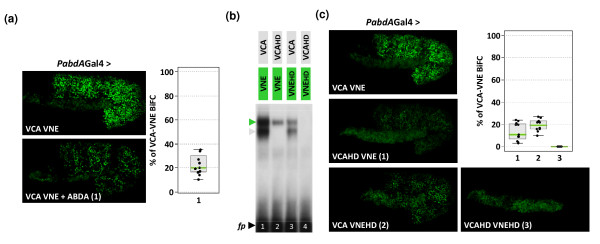
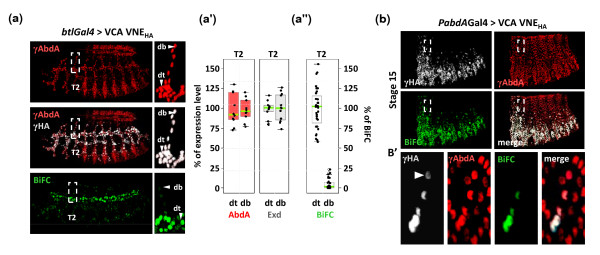
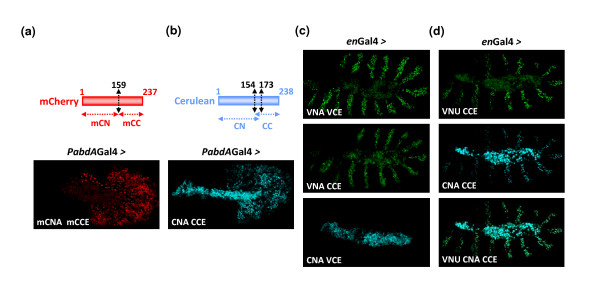
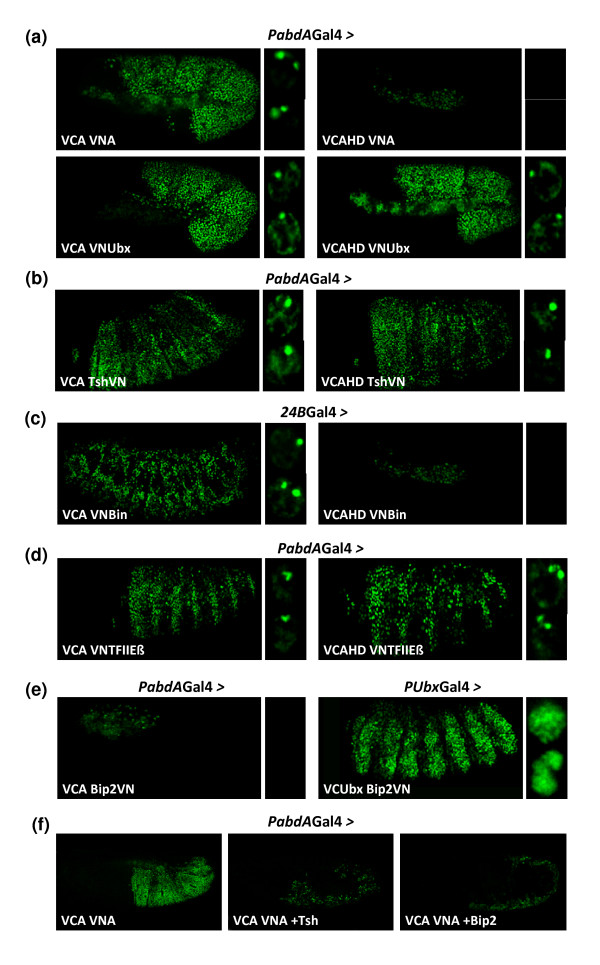
Results: Using a Hox protein partnership as a test case, we investigated the suitability of BiFC for the study of protein interactions in the living Drosophila embryo. Importantly, all BiFC parameters were established with constructs that were stably expressed under the control of endogenous promoters. Under these physiological conditions, we showed that BiFC is specific and sensitive enough to analyse dynamic protein interactions. We next used BiFC in a candidate interaction screen, which led to the identification of several Hox protein partners.

Conclusion: Our results establish the general suitability of BiFC for revealing and studying protein interactions in their physiological context during the rapid course of Drosophila embryonic development.


Figures

Figure 1
Figure 1
Influence of the identity and position of fusions on the AbdA-Exd (abdominalA-extradenticle) complex assembly in vitro. (a) A schematic representation of the fusion proteins realized between Exd (dark grey), AbdA (light grey) and split Venus fragments (VN, green). The homeodomain (HD) of AbdA and Exd is also indicated. (b) Monomere DNA binding activities of AbdA fusion proteins (black arrowhead) on the Distalless consensus probe (Dllcon). (c) Monomere DNA binding activities of Exd fusion proteins (bracket) on the Pbx1 recognition sequence (PRS) probe. Note that migrations do not necessarily correspond to the size of the protein since electrophoretic mobility shift assays (EMSAs) are performed in non-denaturated conditions. Diagrams on the right classify the fusion proteins as a gradient of their DNA binding affinities. This representation was obtained from the quantification of each band and values were clustered with the MultiExperiment Viewer (MeV) software. (d) EMSA with all combinations of AbdA and Exd fusion proteins on the Dllcon probe, as indicated above the gel. The diagram on the right was obtained as in (b) and (c). Combinations of fusion proteins used for the in vivo bimolecular fluorescence complementation (BiFC) analysis are highlighted in red. The black arrowhead indicates the monomer binding of AbdA proteins. (e) Comparison of the efficiency of complex formation between AbdA or VC-AbdA (VCA) and VN-Exd (VNE). The bracket indicates dimers and black arrowhead AbdA monomers, as confirmed by supershifts with the anti-Exd (lane 5) and anti-AbdA (lane 6) antibodies. The diagram on the right illustrates the level of complex formation in comparison to monomer DNA binding affinities, as in (d). All EMSAs were performed with identical amounts of Exd (40 ng) and AbdA (20 ng) proteins, except in (e) where 20 ng and 40 ng of AbdA have been used (as illustrated by white-grey boxes above the gel).
Figure 2
Figure 2
Establishing physiological levels of fusion protein expression. (a) A P-element insertion in the bithorax locus abolishes abdA expression and reproduces the expression profile of abdA. Compared to heterozygous embryos (upper panel), AbdA (abdominalA) expression (grey) is absent in embryos homozygous for the P insertion (named HC7JA1 [27]) that contains the β-galactosidase (β-Gal, red) reporter protein (bottom panel). (b) Establishing physiological levels of VCA expression with the armadillo (arm)-Gal4 driver. The average level of VCA expression at 29°C is quantified in the T2 thoracic segment and compared to the level of endogenous AbdA in the A2 segment of a wild type embryo (red-dotted circles). Fluorescent immunostainings were similarly performed with an anti-AbdA antibody (grey). Graph on the right is a boxplot representation of the statistical quantification of the surface and intensity of the fluorescent AbdA immunostaining (see also Methods). (c) Establishing physiological levels of expression with the abdA-Gal4 driver. Quantifications were measured with an anti-green fluorescent protein that recognises the VC fragment of VCA. Fluorescent immunostainings (grey) were performed in embryos expressing VCA either with arm-Gal4 or PabdA-Gal4 at 29°C. (d) The VC-AbdA (VCA) and VN-AbdA (VNA) fusion proteins are expressed at similar levels. Stage 10 embryos homozygous for the PabdA-Gal4 driver (symbolized by the exponent) and carrying one copy of VCA or VNA are stained with anti-AbdA antibody (grey). In these embryos, endogenous AbdA is absent, revealing the expression level of AbdA fusion proteins only. (e) The VN-extradenticle (Exd; VNE), VC-Exd (VCE) and Exd-VC (EVC) fusion proteins are expressed at similar levels. Exd fusion proteins are HA-tagged and were expressed with the abdA-Gal4 driver, as indicated. Graph on the right shows the level of fluorescent immunostaining of EVC (4) and VCE (5) when compared to levels of VNE. Fluorescent immunostaining (gray) against the HA tag was quantified as previously.
Figure 3
Figure 3
Influence of fusion topologies on abdominalA (AbdA) and extradenticle (Exd) functions in vivo. (a) Cuticle phenotypes of abdA mutants (homozygous for PabdA-Gal4) and rescue activities by AbdA fusion proteins. Mutant larvae are characterized by the loss of denticle rows in A2-A7 segments, presenting a thinner A1-like organization. Enlargements are focused on the A1-A3 segments. Expression of AbdA or VCA in this mutant context restores the A2-like shape of denticle rows. Expression of VNA is less efficient in the rescue, leading to an intermediary A1/A2 organization of denticle belts. Red lines indicate the anterior expression boundary of the abdA-Gal4 driver. (b) Rescue of exd cuticle phenotypes by Exd fusion proteins. In zygotic exdXP11 mutant embryos, the T3 segment acquires a mix T1/abdominal identity, while the A1 and A2 segments resemble to more posterior abdominal segments (respectively to A3-like and A4-like segments). The rescue efficiency of Exd fusion proteins was measured in abdominal segments by using the Ultrabithorax(Ubx)-Gal4 driver ([28] and Additional File 1). Abdominal phenotypes were rescued by Exd or VNE and VCE (not shown) fusion proteins. EVC led to an intermediary rescue, with A1 and A2 segments acquiring respectively an A2-like and A3-like morphology. (c) Regulatory effects of AbdA fusion proteins on the Distalless (Dll) enhancer DME [26]. β-Galactosidase (β-Gal) immunostaining (red) reveals the expression of a lacZ reporter gene that is under the control of DME cis-regulatory sequences. Ectopic expression of AbdA (green) in the thoracic T2 segment with the paired (prd)-Gal4 driver led to complete repression of the β-Gal. VCA, and to a lesser extend VNA, are also able to repress DME. Graph on the right shows the statistical quantification of the repression of the β-Gal by AbdA (1), VCA (2) and VNA (3), as deduced from the level of the red fluorescent signal in T2.
Figure 4
Figure 4
Influence of incubation times at 4°C on the level of bimolecular fluorescence complementation (BiFC) signals and embryonic lethality. (a) Influence of various incubation times on the level of BiFC signals. BiFC resulted from the expression of the VCA and VNE fusion proteins with the abdA-Gal4 driver. Confocal images of stage 10 embryos were taken under same parameters of acquisition after various periods of incubation at 4°C, as indicated. (b) Statistical representation of the effect of incubation times on the embryonic lethality (black curve) and on BiFC levels resulting from the VCA/VNE assembly (green curve) or from VN/VC interactions (dotted-green curve, not quantified with regard to VCA/VNE, as symbolised by double lines). An incubation time of 28 h (highlighted in red) was considered as best appropriate for visualizing BiFC with fusion proteins (with a corresponding low rate of lethality and high level of fluorescence). This time was systematically applied for BiFC observations described in the following figures. See also Material and Methods.
Figure 5
Figure 5
Influence of fusion topologies on bimolecular fluorescence complementation (BiFC) signals resulting from abdoninalA/exradenticle (AbdA/Exd) complex assembly. (a) The brightness of fluorescence resulting from BiFC varies depending of the combination of AbdA and Exd fusion proteins: VCA/VNE (1) produced strong BiFC, while VNA/VCE (2) and VNA/EVC (3) complexes produced weak and no BiFC under same parameters of confocal acquisition, respectively. (b) Compared to (a), the laser power is increased to its maximum in order to visualize BiFC resulting from the VNA/EVC complex assembly. Consequently, BiFC signals resulting from VCA/VNE are saturated and the corresponding quantification can only be estimated under such parameters of acquisition. See also Additional File 3.
Figure 6
Figure 6
Specificity of bimolecular fluorescence complementation (BiFC) in the Drosophila embryo . (a) BiFC in live embryos expressing VCA and VNE either alone or with the parental wild type abdominalA (AbdA) protein (combination 1), as indicated. (b-c) Abolishing DNA binding of AbdA and extradenticle (Exd) abolishes heterodimeric complex formation. (b) Electrophoretic mobility shift assays (EMSAs) with wild type or homeodomain (HD)-mutated AbdA and Exd fusion proteins were performed on the Dll consensus probe [32]. The HD mutation in one partner strongly affects the heterodimeric complex formation (green arrowhead), while no complex is formed when both partners are mutated. The grey arrowhead indicates AbdA monomer binding. (c) BiFC analysis in embryos expressing various combinations (numbered 1 to 3) of wild-type or HD-mutated fusion proteins, as indicated. All fusion proteins were expressed with the abdA-Gal4 driver, and quantifications were performed in stage 10 embryos. See also Additional File 5. Diagrams in (a) and (c) are boxplot representations of the statistical quantification of the surface and intensity of fluorescent signals measured for each indicated combination (numbers in abscises) in the whole embryo.
Figure 7
Figure 7
Bimolecular fluorescence complementation (BiFC) can reveal a spatial control of protein interactions in the Drosophila embryo. (a) Spatial control of the BiFC signal resulting from the VCA/VNE complex assembly in the tracheal system. Despite the uniform expression of abdominalA (AbdA; anti-AbdA, red) and extradenticle (Exd; anti-HA, grey) fusion proteins in all tracheal branches with the breathless (btl)-Gal4 driver, BiFC is mostly apparent in the dorsal trunk (dt) and strikingly weaker in other tracheal branches. Enlargements (dotted-white boxes) focused on this discrepancy in the T2 segment between the dt and the dorsal branch (db). Note that endogenous AbdA protein is not present in this segment. (a') Statistical quantification of the VCA (red-filled boxplot) and VNE (grey-filled boxplot) expression levels in the dt and db of the T2 segment, as deduced from immunostainings. (a'') Despite comparable expression levels of VCA and VNE fusion proteins in the two tracheal branches, BiFC is statistically lower in the db than in the dt. A total of five nuclei in ten different embryos were quantified in the two corresponding branches. (b-b') Spatial dynamics of the BiFC signal in the dorsal epidermis of stage 15 embryos. Expression of fusion proteins (as revealed with anti-HA that specifically recognizes the HA-tagged VNE fusion protein, grey) in embryos heterozygous for the abdA-Gal4 driver is progressively lost in dorsal most parts of the epidermis, while endogenous AbdA (red, as revealed with an anti-AbdA antibody) continues to be homogeneously expressed. BiFC signal (green) follows the dynamic of the abda-Gal4 driver since it is no longer observed in dorsal most parts of the embryo, even when fusion proteins are not completely absent (as revealed with the anti-HA: white arrowhead in b', corresponding to the enlargement of white-dotted boxes in b).
Figure 8
Figure 8
Multicolour bimolecular fluorescence complementation (BiFC) and simultaneous visualization of multiple protein interactions. (a) BiFC with the red fluorescent protein mCherry. Position of the cut is indicated and was chosen according to previous works in cell cultures [9]. The abdominalA (AbdA) and extradenticle (Exd) fusion proteins were generated with the N-terminal (mCN) or C-terminal (mCC) fragment of mCherry, respectively. BiFC was visualized with the abdA-Gal4 driver. (b) BiFC with the blue fluorescent protein Cerulean. Split Cerulean fragments were generated as in Venus. The AbdA and Exd fusion proteins were constructed with the N-terminal (CN) or C-terminal (CC) fragment of Cerulean, respectively. BiFC was visualized with the abdA-Gal4 driver. (c) Complementation between split fragments of the Venus and Cerulean fluorescent proteins. The VN and CC fragments are able to complement, producing a Venus-like fluorescent signal that is weaker than the one obtained between split fragments of Venus. The CN and VC fragments do not produce BiFC signals, as previously described in cell cultures [7]. Fusion proteins were expressed with the engrailed (en)-Gal4 driver. (d) Multicolour BiFC between ultrabithorax (Ubx), AbdA and Exd proteins fused to split fragments of the Venus and Cerulean proteins, as indicated. All fusion proteins are expressed simultaneously with the en-Gal4 driver. Images of live embryos were acquired separately with specific filters (see Methods). Note that the fluorescence in the middle of the embryo is not specific and corresponds to the auto-fluorescence of the amnioserosa. Auto-fluorescence is particularly strong in the Cerulean spectrum.
Figure 9
Figure 9
Suitability of bimolecular fluorescence complementation (BiFC) for in vivo identification of interacting partners (a) BiFC resulting from abdominalA (AbdA)-AbdA and AbdA-ultrabithorax (Ubx) interactions. The homeodomain (HD) mutation in AbdA abolishes homodimeric complex formation only. (b) BiFC between AbdA and the transcription factor Teashirt (Tsh). The HD mutation in AbdA does not abolish AbdA/Tsh complex formation. (c) BiFC between AbdA and the transcription factor Biniou (Bin). Fusions proteins were expressed in the mesoderm. The HD mutation in AbdA abolishes AbdA/Bin complex formation. (d) BiFC between AbdA and the basal transcription machinery protein TFIIbeta. The HD mutation in AbdA does not abolish AbdA/TFIIbeta complex formation. (e) BiFC between AbdA or Ubx and the basal transcription machinery protein BIP2. No BiFC can be visualized between AbdA and BIP2. (f) Competition experiments against BiFC resulting from the VCA/VNA complex assembly. Simultaneous expression of Tsh or BIP2 drastically affects BiFC, suggesting that these two partners interact with AbdA fusion proteins, thereby titrating BiFC complexes. Candidate interacting partners are fused to the VN fragment as indicated, and drivers used are written above pictures. Enlargements on the right focused on the BiFC profile within nuclei.

References

    1. Prasher DC, Eckenrode VK, Ward WW, Prendergast FG, Cormier MJ. Primary structure of the Aequorea victoria green-fluorescent protein. Gene. 1992;111(2):229–233. - PubMed
    1. Abedi MR, Caponigro G, Kamb A. Green fluorescent protein as a scaffold for intracellular presentation of peptides. Nucleic Acids Res. 1998;26(2):623–630. - PMC - PubMed
    1. Baird GS, Zacharias DA, Tsien RY. Circular permutation and receptor insertion within green fluorescent proteins. Proc Natl Acad Sci USA. 1999;96(20):11241–11246. - PMC - PubMed
    1. Ghosh Indraneel, Hamilton AD, Lynn Regan. Antiparallel Leucine Zipper-Directed Protein Reassembly: Application to the Green Fluorescent Protein. J Am Chem Soc. 2000;122:5658–5659.
    1. Nagai T, Sawano A, Park ES, Miyawaki A. Circularly permuted green fluorescent proteins engineered to sense Ca2+ Proc Natl Acad Sci USA. 2001;98(6):3197–3202. - PMC - PubMed

Publication types

LinkOut - more resources