Review
. 2011 Jun;276(1-2):34-43.
doi: 10.1016/j.heares.2011.01.014. Epub 2011 Jan 27.

Complex primary afferents: What the distribution of electrophysiologically-relevant phenotypes within the spiral ganglion tells us about peripheral neural coding

Affiliations
Review

Complex primary afferents: What the distribution of electrophysiologically-relevant phenotypes within the spiral ganglion tells us about peripheral neural coding

Robin L Davis et al. Hear Res. 2011 Jun.

Abstract

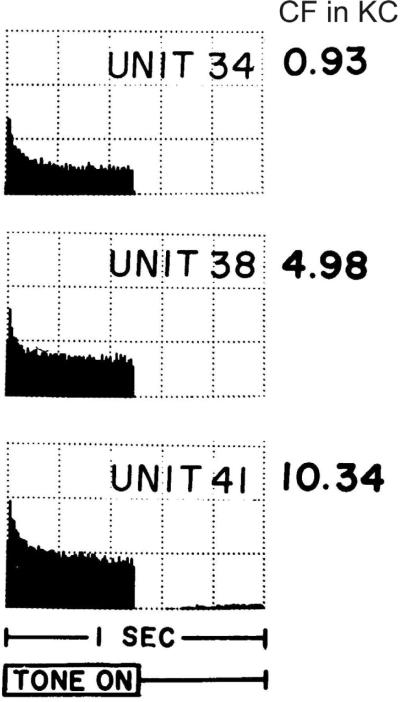
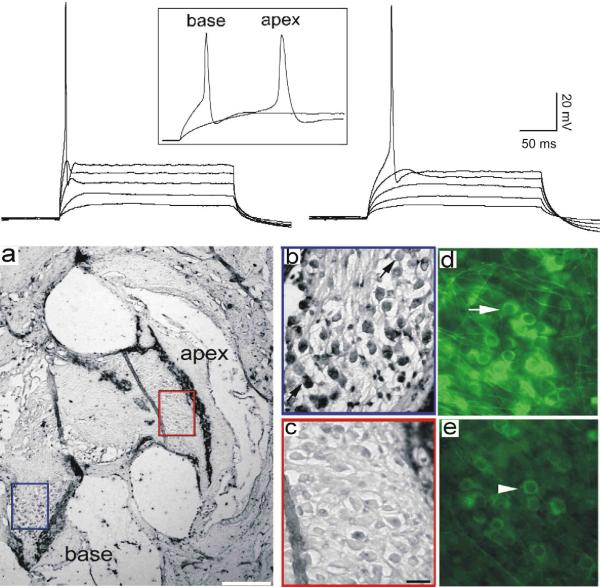
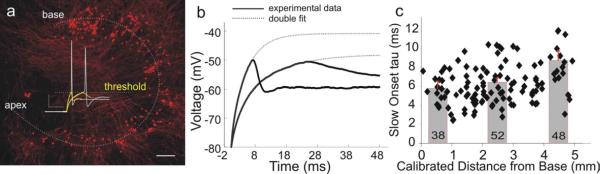
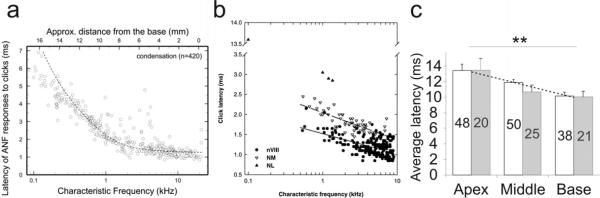
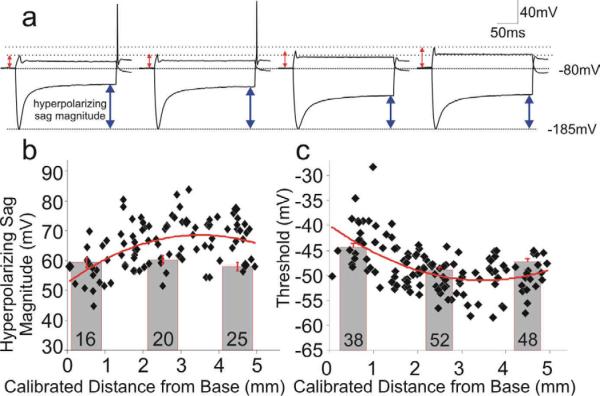
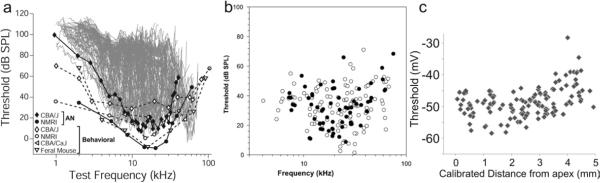
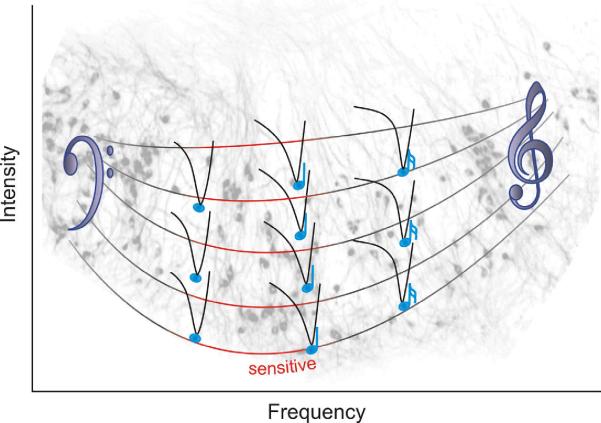
Spiral ganglion neurons are the first neural element of the auditory system. They receive precise synaptic signals which represent features of sound stimuli encoded by hair cell receptors and they deliver a digital representation of this information to the central nervous system. It is well known that spiral ganglion neurons are selectively responsive to specific sound frequencies, and that numerous structural and physiological specializations in the inner ear increase the quality of this tuning, beyond what could be accomplished by the passive properties of the basilar membrane. Further, consistent with what we know about other sensory systems, it is becoming clear that the parallel divergent innervation pattern of type I spiral ganglion neurons has the potential to encode additional features of sound stimuli. To date, we understand the most about the sub-modalities of frequency and intensity coding in the peripheral auditory system. Work reviewed herein will address the issue of how intrinsic electrophysiological features of the neurons themselves have the potential to contribute to the precision of coding and transmitting information about these two parameters to higher auditory centers for further processing.


Figures

Fig. 1
Fig. 1
Post-stimulus time histograms from three units with low to high characteristic frequencies (CF) showed similar response patterns to tone bursts. Recordings were made from cat auditory nerve fibers. Each histogram averages 2 minutes of data. Y-scale: 200 spikes/per increment. Burst levels used: −50 dB for unit 38; −70 dB for unit 34 and 41. Adapted from Kiang et al., 1965
Fig 2
Fig 2
Endogenous electrophysiological firing patterns and voltage-dependent ion channel composition differ between apical and basal spiral ganglion neurons. Top Panel. Series of stacked whole-cell current clamp traces from a basal (left) and apical (right) spiral ganglion neuron highlight differences in response speed. The onset time course and difference in latency are evident from the series of sweeps; the differences in action potential duration can be observed from the inset traces (box). a–e, Anti-BK antibody labeling was enriched in basal compared to apical spiral ganglion neurons in adult cochlea (a–c) and in vitro (d, e). a, Section taken from an adult CBA/CaJ mouse cochlea stained with anti-BK antibody (Alomone Labs, APC-02) showing that the neurons in the base of the cochlea (blue box) were considerably darker than those in the apex (red box). The calibration bar, lower right, represents 200 μm. b, high-magnification view of the basal neurons. c, High-magnification view of the apical neurons. d, postnatal spiral ganglion neurons isolated from the base and maintained in vitro for 7 days also showed intense anti-BK antibody labeling. The arrow indicates a darkly stained neuron. e, Sister cultures of apical neurons treated identically to those in panel d showed only low staining levels. The arrowhead indicates a lightly stained neuron. The scale bar in panel c = 20 μm and applies to panels b–e. Adapted from Adamson et al., 2002a.
Fig. 3
Fig. 3
The neurotrophins BDNF and NT-3 have `yin-yang' regulatory effects on voltage-gated ion channel and synaptic protein composition in spiral ganglion neurons. In general, when one of the electrophysiologically-relevant proteins (described in the text) was up regulated by one neurotrophin, it was down regulated by the other. Kv1.1 and Kv4.2 were exceptions; only up regulation by the respective neurotrophins, BDNF and NT-3, was noted. Table from Flores-Otero et al., 2007.
Fig. 4
Fig. 4
Spiral ganglion neurons plated with their relative locations intact showed graded differences in membrane kinetics that become progressively slower from base to apex. a, A gangliotopic culture, stained with anti-β-tubulin antibody (red), was used to correlate neuronal firing properties with their gangliotopic position. A dotted line was drawn by eye to approximate the apex to base tonotopic axis. Scale bar: 200 μm. Inset current clamp recordings showed differences in onset time constant and latency at threshold with matched holding potential (−80 mV) and voltage threshold from one apical and one basal neuron. b, double-exponential functions (dotted line) fitted to threshold onset (thick black) from the same two recordings in panel a (yellow traces). The long-latency apical neuron (right) showed slower onset time constant than the basal neuron (left). c, slow onset tau (time constant measured from slow exponential component) plotted as a function of location in gangliotopic and neuronal cultures. For this and subsequent figures, scatter plot and bar graph represents gangliotopic culture and neuronal culture data respectively. Number of recordings shown in each bar applies to this and subsequent figures. Panels b and c were adapted from Liu and Davis 2007.
Fig. 5
Fig. 5
Tonotopic comparison of response latencies in vivo and in vitro. a, chinchilla auditory nerve latency responses to intense condensation clicks with custom fit to group data. b, Barn owl auditory nerve latencies as a function of characteristic frequency at different recording sites with logarithmic fits. Filled circles represent responses from the primary afferents, upward and downward triangles show responses from the nucleus laminaris (NL) and nucleus magnocellularis (NM), respectively. c, Average action potential latency at threshold from apex to base. White and gray bar represents data from neuronal and gangliotopic culture respectively. Line fits to combined means. **, P < 0.01, one-way ANOVA with post hoc Tukey-Kramer pairwise comparison. Panels a–c adapted from Temchin et al., 2005, (Koppl, 1997a; Liu and Davis, 2007; Temchin et al., 2005), respectively.
Fig. 6
Fig. 6
Intrinsic threshold and inward rectification of spiral ganglion neurons showed a non-monotonic distribution pattern, with elevated sensitivity and inward rectification positioned in the mid-apical spiral ganglion. a, Current clamp traces illustrate an inverse relationship between threshold voltage (red arrowheads) and hyperpolarizing sag magnitude (blue arrowheads): the higher the threshold (left to right), the lower the sag magnitude. Dashed lines indicate their highest (−45.8mV) and lowest (−57.6mV) threshold levels. Holding potential: −80mV; hyperpolarization peak: −185mV. b & c: hyperpolarizing sag magnitude (b) and threshold (c) plotted as a function of location in gangliotopic and neuronal cultures. Adapted from Liu and Davis, 2007.
Fig. 7
Fig. 7
Comparison of murine auditory thresholds and neuronal intrinsic thresholds. a, The lowest threshold envelope of superimposed tuning curves of auditory nerve fibers in response to tone bursts matched behavioral threshold data. Filled diamonds and circles were auditory nerve data from CBA/J or NMRI mice. Open shapes of diamond, circle, apex-leftward and apex-downward triangles were behavior data from the indicated species. b, Best thresholds (tips of tuning curves) plotted as a function of nerve fiber characteristic frequency. Close/open circles indicate the success/failure in the use of HRP to label the recording site. c, Gangliotopic data from figure 6c re-plotted from apex to base. Panels a–c adapted from (Müller and Smolders, 2005; Taberner and Liberman, 2005) and Liu and Davis, 2007, respectively.
FIG. 8
FIG. 8
There are two parameters of spiral ganglion neuron phenotypic specializations that vary along the tonotopic map. The first represented by the timing of the musical notes at the tips of the neuronal tuning curves is the kinetic features of the neurons at thresholds that vary in a linear gradient. The second represented by the shape of the neuronal cluster shown in the background (gray, stained with anti-β-tubulin antibody) and the U-shaped scale bar is the non-monotonic neuronal sensitivity. The most sensitive neurons (red within the mid-apical region) have elevated resting membrane potentials and enhanced excitability due to reduced threshold voltages.

References

    1. Adamson CL, Reid MA, Davis RL. Opposite actions of brain-derived neurotrophic factor and neurotrophin- 3 on firing features and ion channel composition of murine spiral ganglion neurons. J Neurosci. 2002a;22:1385–96. - PMC - PubMed
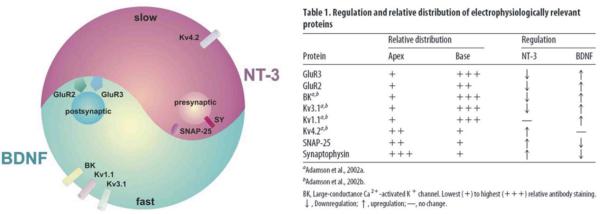
    1. Adamson CL, Reid MA, Mo ZL, Bowne-English J, Davis RL. Firing features and potassium channel content of murine spiral ganglion neurons vary with cochlear location. J Comp Neurol. 2002b;447:331–50. - PubMed
    1. Anniko M, Arnold W, Stigbrand T, Strom A. The human spiral ganglion. ORL J Otorhinolaryngol Relat Spec. 1995;57:68–77. - PubMed
    1. Art JJ, Fettiplace R. Variation of membrane properties in hair cells isolated from the turtle cochlea. J Physiol (Lond) 1987;385:207–42. - PMC - PubMed
    1. Ashmore J, Gale J. The cochlea. Curr Biol. 2000;10:R325–7. - PubMed

Publication types

Substances