Review
. 2011 Jan 28;18(1):10-24.
doi: 10.1016/j.chembiol.2010.11.013.

Biocompatible quantum dots for biological applications

Affiliations
Review

Biocompatible quantum dots for biological applications

Sandra J Rosenthal et al. Chem Biol. .

Abstract

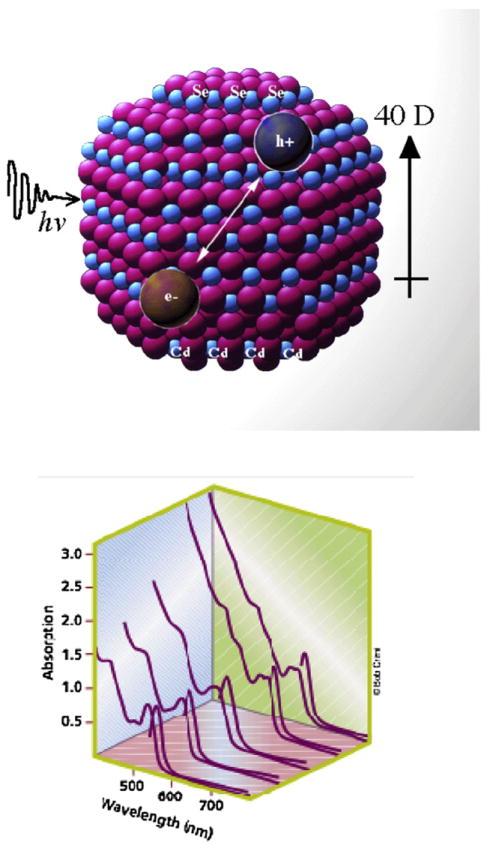
Semiconductor quantum dots are quickly becoming a critical diagnostic tool for discerning cellular function at the molecular level. Their high brightness, long-lasting, size-tunable, and narrow luminescence set them apart from conventional fluorescence dyes. Quantum dots are being developed for a variety of biologically oriented applications, including fluorescent assays for drug discovery, disease detection, single protein tracking, and intracellular reporting. This review introduces the science behind quantum dots and describes how they are made biologically compatible. Several applications are also included, illustrating strategies toward target specificity, and are followed by a discussion on the limitations of quantum dot approaches. The article is concluded with a look at the future direction of quantum dots.


Figures

Figure 1
Figure 1. Putative Structure and Size-Dependent Absorption and Emission Spectra of CdSe Nanocrystals
(A) Upon excitation with a photon, an electron-hole pair is created in a nanocrystal. If the electron and hole recombine, fluorescence is given off. If the carriers get trapped to the surface, they are lost. By coating the surface with another semiconductor, material surface loss is eliminated. (B) Absorption and emission spectra of a series of CdSe nanocrystals. The CdSe core controls the spectral properties of CdSe/CdZnS fluorescent quantum dot. As the size of the core increases, the absorption and emission wavelengths shift to the red. However, as the absorption is continuous above the first excitation peak, one excitation source can be used to excite all sizes of core/shell quantum dots.
Figure 2
Figure 2. Z-STEM of Quantum Dots
(A) Z-STEM image of a CdSe/ZnS core/shell nanocrystal. The intensity profile clearly indicates the interface between core and shell. The shell appears to be growing primarily off of one facet of the core. (B) Aberration-corrected Z-STEM (Fourier filtered) image of a commercial quantum dot (QD655). The CdS shell can be identified by the loss of the anion atomic dumbbell in the image.
Figure 3
Figure 3. Amphiphilic Polymer Encapsulation Strategy
The original nonpolar ligands on the surface of a quantum dot are left intact (A), and an amphiphilic polymer is used to encapsulate the dot in a water-soluble plastic bag (B). Nonpolar side chains of the polymer intercalate with the nonpolar ligands capping the nanocrystal, and the outer polar, chemically reactive groups of the polymer are used for further conjugation (C).
Figure 4
Figure 4. Small Molecule Ligands that Have Been Conjugated to Quantum Dots
(I) A PEGylated serotonin derivative (Rosenthal et al., 2002); (II) a muscimol derivative (Gussin et al., 2006); (III) a dopamine transporter antagonist (Tomlinson et al., 2006); (IV) a serotonin transporter antagonist (Tomlinson et al., 2007); (V) GPI a tumor targeting ligand (Choi et al., 2010); (VI) A derivative of the NSAI D naproxen (Byrne et al., 2007); (VII) dopamine (Clarke et al., 2006); (VIII) glutathione (Tortiglione et al., 2007).
Figure 5
Figure 5. Approach to Single Protein Tracking Using Quantum Dots
(A) Time-lapse images of single quantum dot tagged proteins in living cells are acquired from an optical fluorescent microscope system (e.g., epifluorescence, confocal, or total internal reflection fluorescence [TIRF] microscope). (B) Estimation of the positions of single quantum dots with subpixel accuracy is accomplished by fitting the individual spot intensity values into a two-dimensional Gaussian distribution. After the positions of single quantum dots are identified, trajectory of target protein (gray line) can be subsequently derived from the time-series imaging data. (C) The final aspect of single protein tracking is to analyze the single-quantum dot trajectories. Motion properties (i.e., displacement, velocity, and diffusion coefficient) of the target proteins can then be characterized to understand how the motion dynamics of the target protein is associated with intracellular microstructure or extracellular stimulus.

Similar articles

Cited by

References

    1. Alivisatos AP. Perspectives on the physical chemistry of semiconductor nanocrystals. J Phys Chem. 1996a;100:13226–13239.
    1. Alivisatos AP. Semiconductor clusters, nanocrystals, and quantum dots. Science. 1996b;271:933–937.
    1. An S, Zenisek D. Regulation of exocytosis in neurons and neuroendocrine cells. Curr Opin Neurobiol. 2004;14:522–530. - PubMed
    1. Bakalova R, Zhelev Z, Ohba H, Baba Y. Quantum dot-based western blot technology for ultrasensitive detection of tracer proteins. J Am Chem Soc. 2005;127:9328–9329. - PubMed
    1. Ballou B, Lagerholm BC, Ernst LA, Bruchez MP, Waggoner AS. Noninvasive imaging of quantum dots in mice. Bioconjug Chem. 2003;15:79–86. - PubMed

Substances

LinkOut - more resources