. 2011 Jan 28;18(1):77-89.
doi: 10.1016/j.chembiol.2010.11.012.

A chemical genetics approach reveals H,K-ATPase-mediated membrane voltage is required for planarian head regeneration

Affiliations

A chemical genetics approach reveals H,K-ATPase-mediated membrane voltage is required for planarian head regeneration

Wendy S Beane et al. Chem Biol. .

Abstract

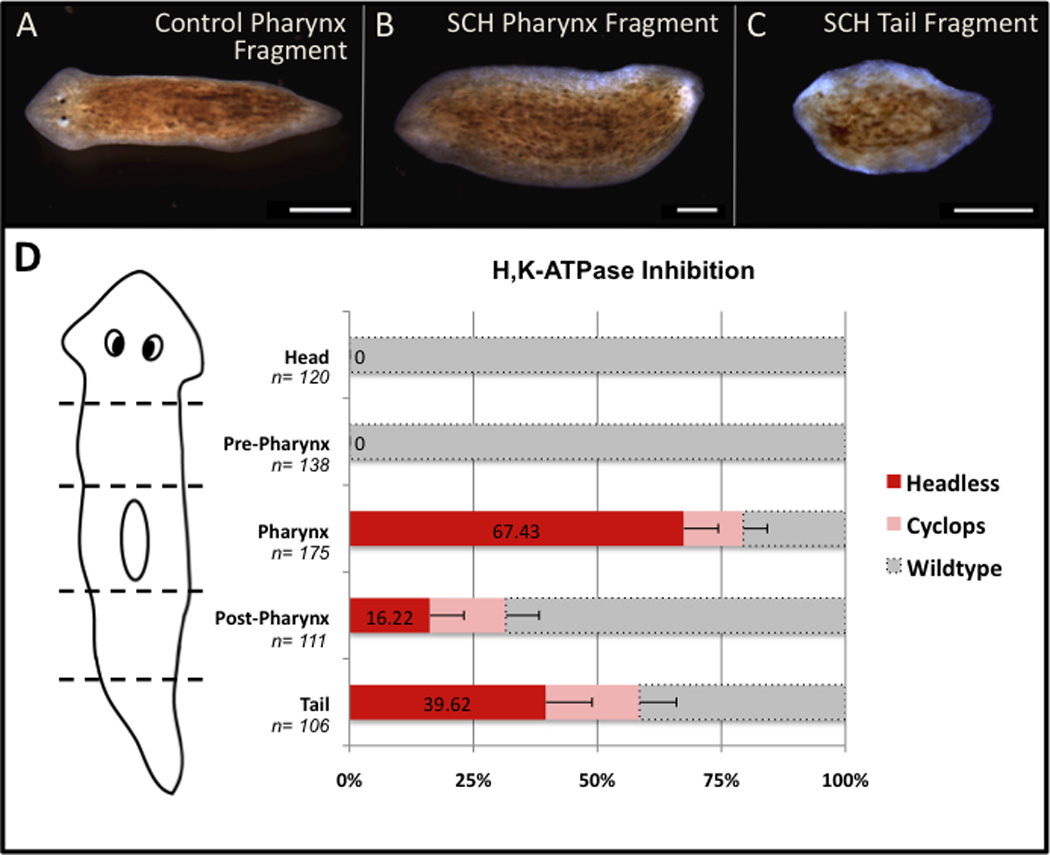
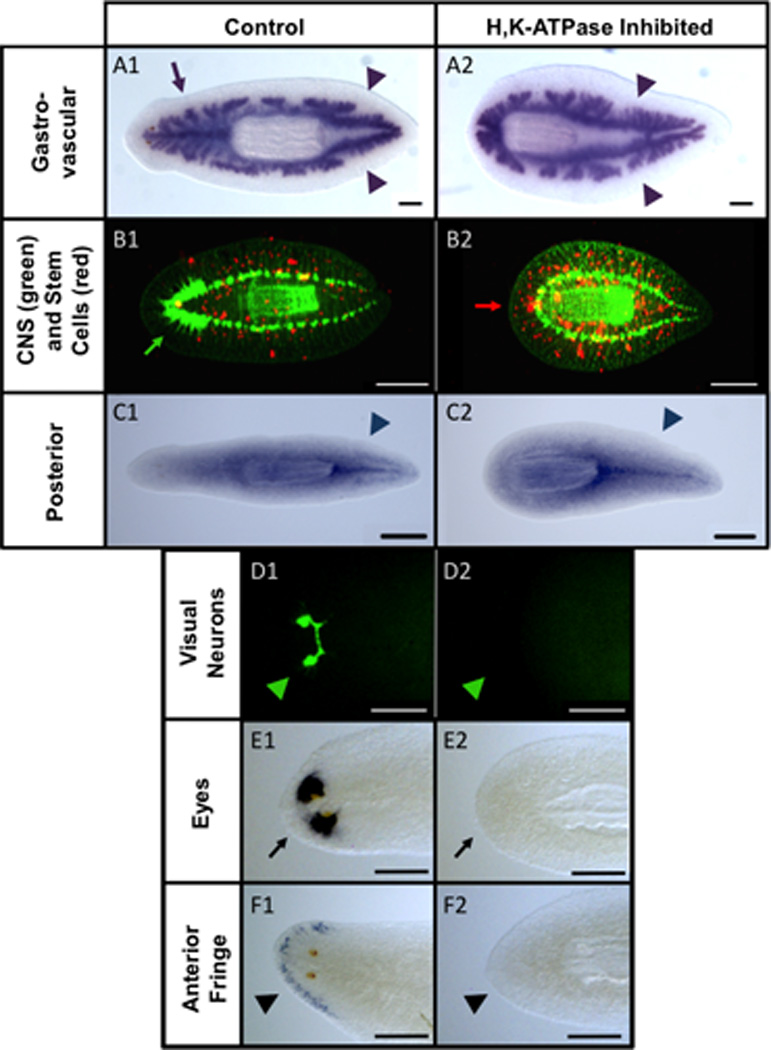
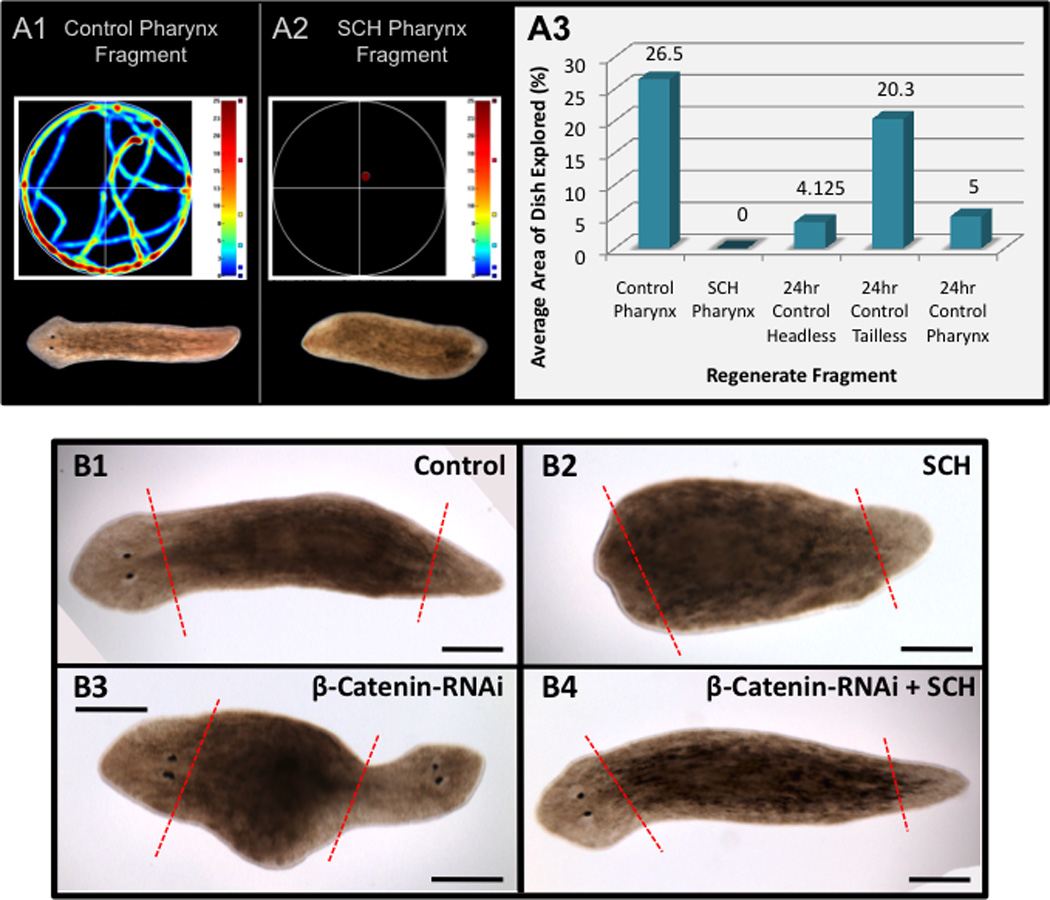
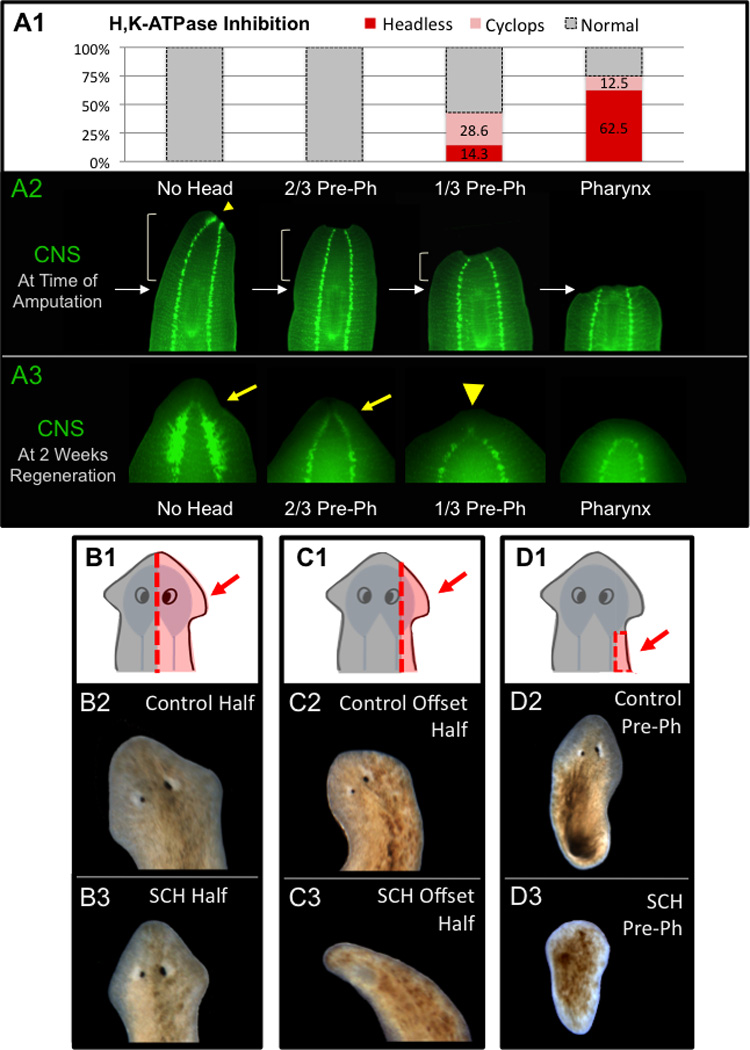
Biophysical signaling is required for both embryonic polarity and regenerative outgrowth. Exploiting endogenous ion transport for regenerative therapies will require direct regulation of membrane voltage. Here, we develop a pharmacological method to target ion transporters, uncovering a role for membrane voltage as a key regulator of anterior polarity in regenerating planaria. Utilizing the highly specific inhibitor, SCH-28080, our data reveal that H(+),K(+)-ATPase-mediated membrane depolarization is essential for anterior gene expression and brain induction. H(+),K(+)-ATPase-independent manipulation of membrane potential with ivermectin confirms that depolarization drives head formation, even at posterior-facing wounds. Using this chemical genetics approach, we demonstrate that membrane voltage controls head-versus-tail identity during planarian regeneration. Our data suggest well-characterized drugs (already approved for human use) might be exploited to control adult stem cell-driven pattern formation during the regeneration of complex structures.


Figures

Figure 1
Figure 1. H,K ATPase inhibition blocks head regeneration
Effects of 18µM SCH-28080 (SCH). (A) Control pharynx, (B) SCH-treated pharynx, and (C) SCH-treated tail fragments at 14 days regeneration. Anterior to the left. Scale bars=500µm. (D) Phenotype distribution by anatomical region. Error bars=95% confidence intervals (CI). See also Figures S1 and S2.
Figure 2
Figure 2. Blocking H,K ATPase activity prevents anterior gene expression
Anterior-Posterior and tissue-specific marker analyses at 14 days regeneration. (A) Innexin7. Arrow=single anterior branch (lost in A2). Arrowheads=double posterior branches. (B) Synapsin (green), Phospho-Histone H3 (red). Green arrow=brain (lost in B2). Red arrow=neoblasts atypically at “anterior” end (B2). (C) Hox9. Arrowheads=tail staining (not duplicated in C2). (D) Arrestin. Arrowhead=optic nerves (lost in D2). (E) Eye marker 0251_HH, and (F) anterior marker 0821_HN. Arrow=eye staining (E1) and arrowhead=anterior fringe staining (F1), (both lost in E2, F2). n≥5 for each. Anterior to the left. Scale bars=250µm.
Figure 3
Figure 3. H,K ATPase activity is required for brain induction and ectopic head formation
(A) Behavioral analyses. Heat maps track movement for worms shown. Red indicates most time spent in area. (A1) Control and (A2) SCH-treated pharynx fragments at 14 days regeneration. (A3) Average area of dish covered by each regenerate type. 95% CI: Control pharynx (n=8, CI=0.31); SCH pharynx (n=9, CI=0); 24-hour control headless (n=8, CI=0.14); 24-hour control tailless (n=10, CI=0.25); 24-hour control pharynx (n=10, CI=0.14). (B) β-catenin-RNAi assay with pharynx regenerates. (B1) Control injected. (B2) SCH-treated control-injected. (B3) β-catenin-RNAi injected (66.7% double-heads, CI=0.27). (B4) SCH-treated β-catenin-RNAi injected (25% double-heads, CI=0.25). Red dashed lines=amputation planes. Anterior to the left. Scale bars=250µm.
Figure 4
Figure 4. Anterior CNS rescues H,K-ATPase inhibition
(A) Anterior amputations of SCH-treated worms. (A1) Worms amputated between the head and pharynx, scored at 2 weeks. 95% CI for 1/3-Pre-pharynx fragments: headless (CI=0.18), cyclops (CI=0.24); for Pharynx fragments: headless (CI=0.24), cyclops (CI=0.19). (A2) CNS remaining at time of amputation. Arrowhead=posterior brain remnant. Arrows=anterior tip of pharynx. Brackets=amount of pre-pharyngeal region remaining. (A3) CNS at 2 weeks regeneration. Arrows=brain regeneration. Arrowhead=cyclopic brain. CNS marker: Synapsin. (B–C) Sagittal (longitudinal) cuts including (B, even halves) or excluding (C, offset halves) CNS. (B2–C2) Control and (B3–C3) H,K-ATPase-inhibited fragments. (B3, 0% headless, n=42). Excluding anterior CNS allows headless regenerates (C3, 26% headless, n=43). (D) Small pre-pharynx fragments cut to exclude CNS (ventral nerve cords). Excluding anterior CNS allows headless regenerates in SCH-resistant pre-pharynx fragments (D3, 11.8% headless, n=34). Red dashed lines=amputation plane. Arrows & red shaded areas=fragments shown below. Anterior is up.
Figure 5
Figure 5. Regeneration rescues H,K-ATPase-inhibited worms
Headless regenerates wounded without drug at the “anterior” end (determined by pharynx direction). (A) Wound with one amputation plane and no blastema (A3) fails to rescue head (A4). 100% headless (n=16). (B) Wound with two amputation planes and small bit of tissue removed produces a small blastema (B3) and cyclopia (B4). 75% cyclopic (n=4). (C) Wound with more tissue removed produces a large blastema (C3) and full anterior rescue (C4). 75% head rescue (n=24). Panels show same worms before re-cutting (A1–C1), ½ hour after cutting (A2–C2), at 3 days (A3–C3) and 14 days (A4–C4) regeneration. Dashed red lines=amputation planes. Arrowheads=wound. Arrows=blastema (unpigmented regions in B3–C3) or wound site (for A3). Anterior is up. Scale bars=500µm.
Figure 6
Figure 6. H,K-ATPase activity depolarizes the anterior blastema membrane potential
Membrane voltage assay using DiBAC. (A) Diagram of cuts. Pharynx fragments cut with slanted anterior ends to mark original A/P axis. (B) Regenerates assayed at 24 hours post amputation (B1–B3), and phenotypes scored at 14 days (B4–B6). Images are pseudocolored blue-green-red. Brighter pixels (green to red) indicate relatively depolarized cells (inside more positive with respect to outside), while darker pixels (blue) indicate relatively hyperpolarized cells (inside more negative). (B1, B4) SCH-treated, (B2, B5) control, and (B3, B6) ivermectin (IVM)-treated fragments. Arrowheads=depolarized blastemas. Anterior is up. Scale bars=500µm. (C) Whole fragment comparisons of 24-hour pharynx regenerates. SCH-treated (n=13), control (n=19), and IVM-treated (n=11). Asterisks=p<<0.0001. Error bars=standard deviation. See also Figure S3.
Figure 7
Figure 7. Membrane voltage regulates blastema polarity
(A) Intracellular calcium assay using Fura-2-AM. 24 hour pharynx regenerates. (A1–A2) Calcium is significantly upregulated in control anterior blastemas (letter A) compared to posterior blastemas (P). Asterisk=p<<0.0001. (A3–A4) H,K-ATPase inhibition eliminates this upregulation (p<0.001). (B) Inhibition of voltage-gated calcium channels using nicardipine. Pharynx regenerates at 14 days regeneration. (B1) Control. (B2-3) Nicardipine regenerates have reduced anterior: (B2) headless (8.2%) and (B3) failure to form both eyes (34.4%, arrow). Scale bars=500µm. (C) Model. Wildtype fragments have a membrane potential gradient with the head blastema most depolarized and the tail blastema least depolarized. SCH-mediated H,K-ATPase inhibition results in relative hyperpolarization and ivermectin treatment in relative depolarization. Hyperpolarized blastemas become either tail or headless, while depolarized blastemas always result in head formation. IVM=ivermectin, hpa=hours post amputation, dpa=days post amputation.

Comment in

References

    1. Adams DS. A new tool for tissue engineers: ions as regulators of morphogenesis during development and regeneration. Tissue Eng Part A. 2008;14:1461–1468. - PubMed
    1. Adams DS, Levin M. Inverse drug screens: a rapid and inexpensive method for implicating molecular targets. Genesis. 2006a;44:530–540. - PMC - PubMed
    1. Adams DS, Levin M. Strategies and Techniques for Investigation of Biophysical Signals in Patterning. In: Whitman M, Sater AK, editors. Analysis of Growth Factor Signaling in Embryos. CRC Press; 2006b. pp. 177–262.
    1. Adams DS, Masi A, Levin M. H+ pump-dependent changes in membrane voltage are an early mechanism necessary and sufficient to induce Xenopus tail regeneration. Development. 2007;134:1323–1335. - PubMed
    1. Adams DS, Robinson KR, Fukumoto T, Yuan S, Albertson RC, Yelick P, Kuo L, McSweeney M, Levin M. Early, H+-V-ATPase-dependent proton flux is necessary for consistent left-right patterning of non-mammalian vertebrates. Development. 2006;133:1657–1671. - PMC - PubMed

Publication types

LinkOut - more resources