. 2011 Nov;22(11):1064-73.
doi: 10.1016/j.jnutbio.2010.09.004. Epub 2011 Jan 28.

Bioactives from bitter melon enhance insulin signaling and modulate acyl carnitine content in skeletal muscle in high-fat diet-fed mice

Affiliations

Bioactives from bitter melon enhance insulin signaling and modulate acyl carnitine content in skeletal muscle in high-fat diet-fed mice

Zhong Q Wang et al. J Nutr Biochem. 2011 Nov.

Abstract

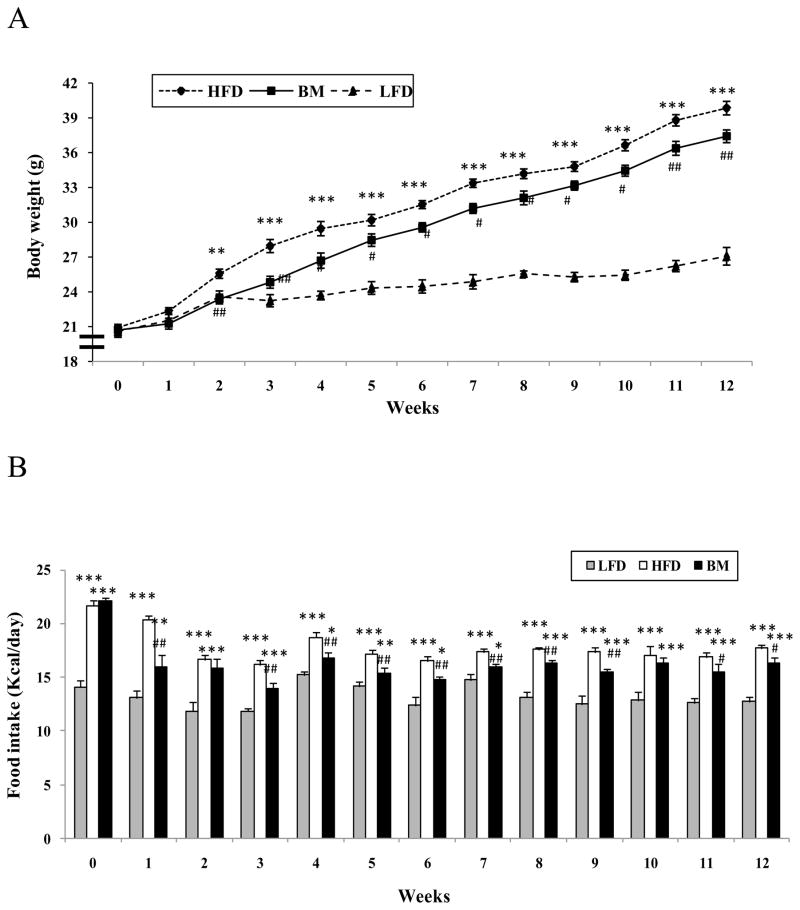
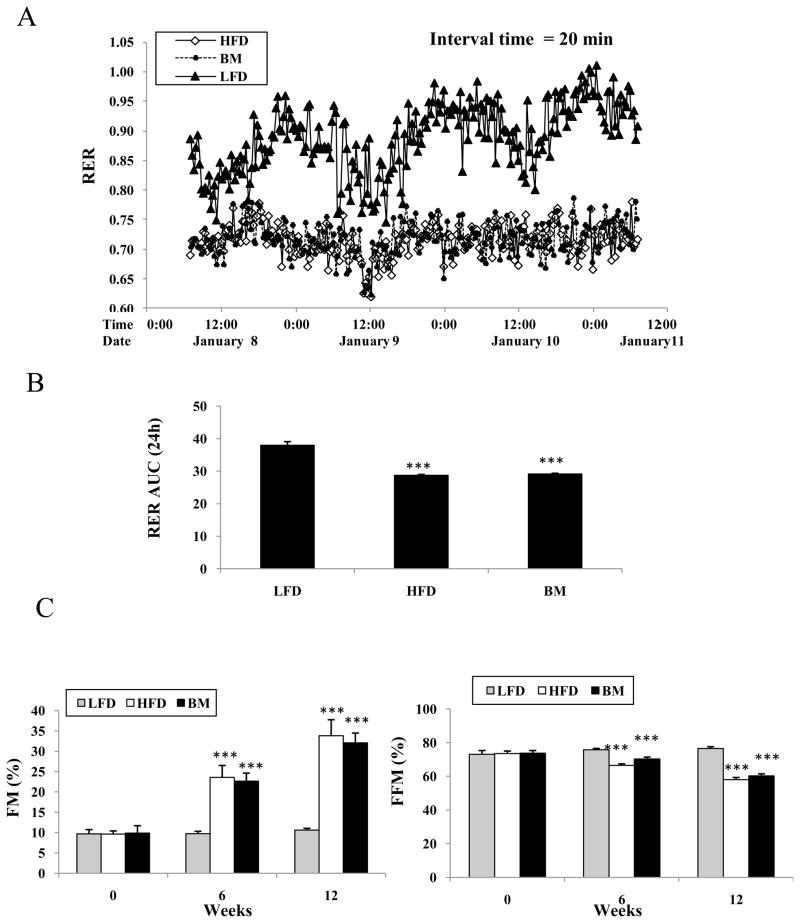
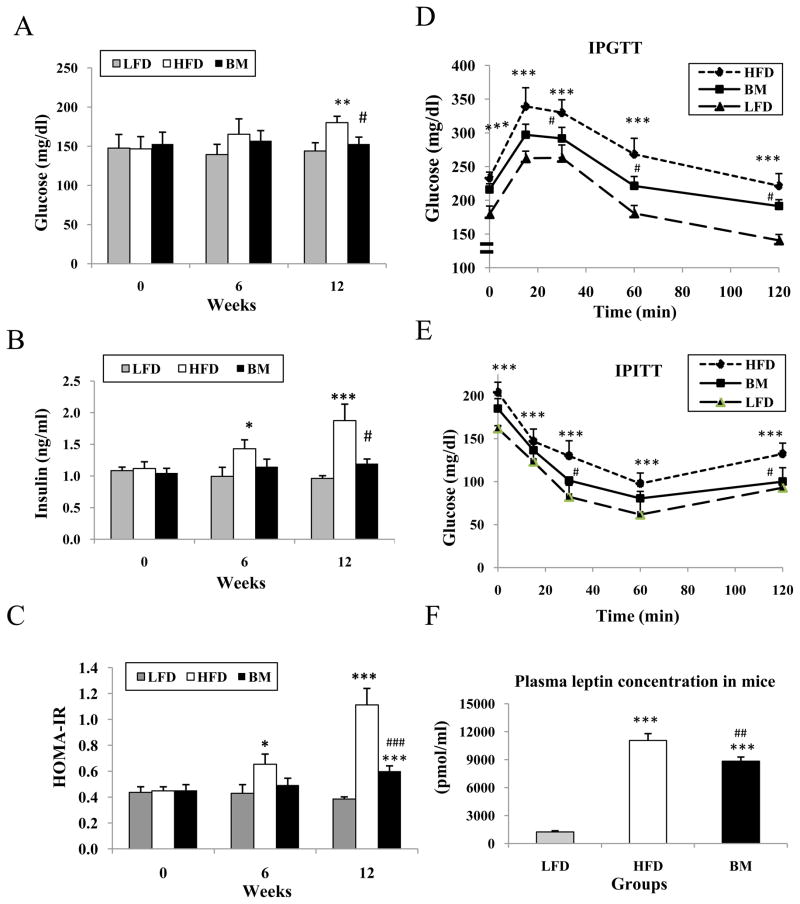
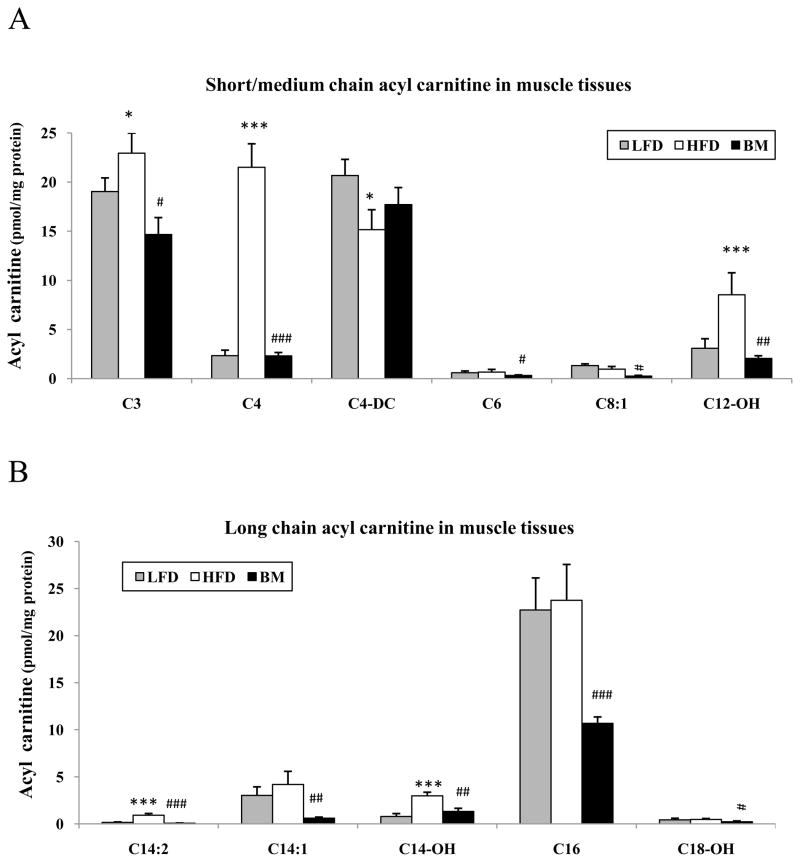
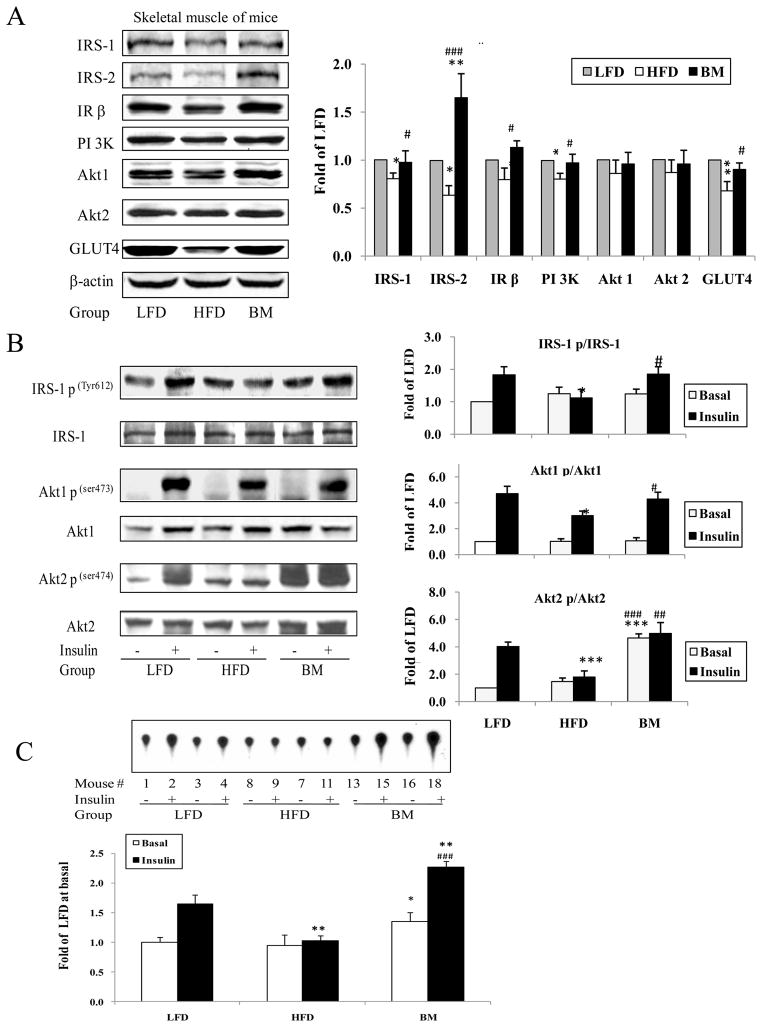
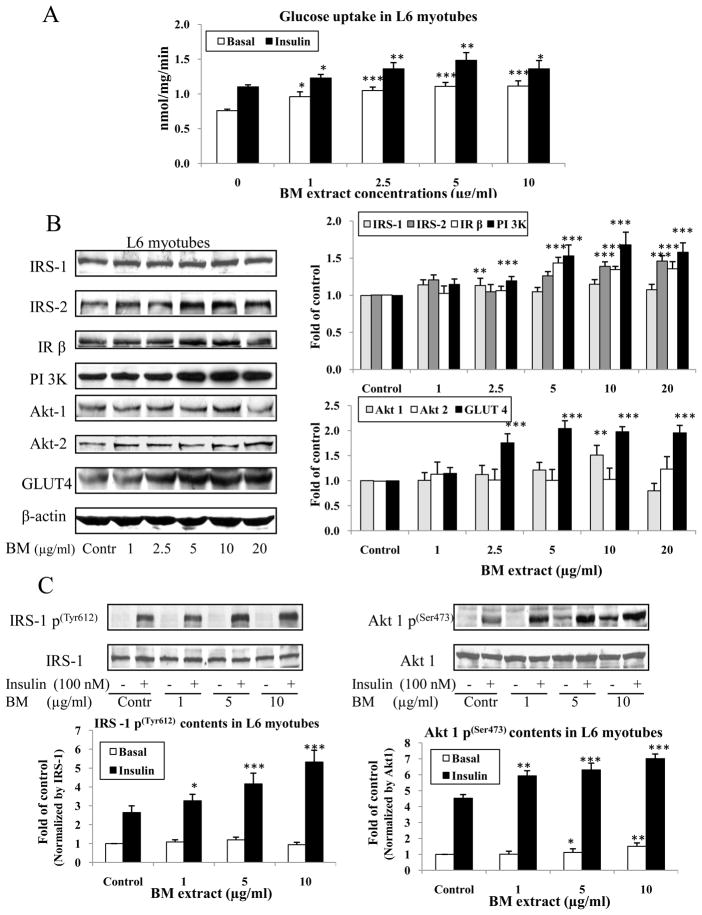
Bioactive components from bitter melon (BM) have been reported to improve glucose metabolism in vivo, but definitive studies on efficacy and mechanism of action are lacking. We sought to investigate the effects of BM bioactives on body weight, muscle lipid content and insulin signaling in mice fed a high-fat diet and on insulin signaling in L6 myotubes. Male C57BL/6J mice were randomly divided into low-fat diet control (LFD), high-fat diet (HFD) and HFD plus BM (BM) groups. Body weight, body composition, plasma glucose, leptin, insulin and muscle lipid profile were determined over 12 weeks. Insulin signaling was determined in the mouse muscle taken at end of study and in L6 myotubes exposed to the extract. Body weight, plasma glucose, insulin, leptin levels and HOMA-IR values were significantly lower in the BM-fed HFD group when compared to the HFD group. BM supplementation significantly increased IRS-2, IR β, PI 3K and GLUT4 protein abundance in skeletal muscle, as well as phosphorylation of IRS-1, Akt1 and Akt2 when compared with HFD (P<.05 and P<.01). BM also significantly reduced muscle lipid content in the HFD mice. BM extract greatly increased glucose uptake and enhanced insulin signaling in L6 myotubes. This study shows that BM bioactives reduced body weight, improved glucose metabolism and enhanced skeletal muscle insulin signaling. A contributing mechanism to the enhanced insulin signaling may be associated with the reduction in skeletal muscle lipid content. Nutritional supplementation with this extract, if validated for human studies, may offer an adjunctive therapy for diabetes.


Conflict of interest statement

Author disclosures: Z.Q. Wang, X. H Zhang, YM. Yu, D Ribnicky and W.T. Cefalu have no conflicts of interest.

Figures

Figure 1
Figure 1
Effects of BM extract on body weight and food intake in mice. Body weight and food intake were recorded weekly. Panel A shows body weight and panel B illustrates food intake in All three groups of mice. Data are presented as Mean ± SEM (n=6–7/group), * P<0.05, ** P<0.01 and ***P<0.001, HFD or BM group vs LFD control. #P<0.05, ##P<0.01 BM vs HFD.
Figure 2
Figure 2
Energy expenditure and body composition in mice groups. At week 8, mice were placed into metabolic chambers with water and food for seven days. Animals’ locomotion, O2 consumption and CO2 emission were automatically monitored. RER (Respiratory Exchange Rate) was calculated by VCO2/VO2 values and showed in panel A and B. Penal C shows body composition measured at week 0, 6 and 12. Fat mass (FM) and free fat Mass (FFM) results were presented as percent of body weight in the three group animals. Mean ± SEM (n=6–7/group), * P<0.05, ** P<0.01 and ***P<0.001, HFD or BM vs LFD control. #P<0.05, ##P<0.01 BM vs HFD.
Figure 3
Figure 3
Glucose, insulin and leptin concentration, and IPGTT and IPITT in mice. Four hour fasting serum was collected at week 0, 6 and 12 respectively for measuring glucose and insulin concentration. Panel A is glucose levels, panel B shows insulin concentration and Panel C is HOMA results in the mice. IPGTT was carried out at week 10 after overnight fasting and IPITT was performed at week 11 after 4 hour fasting respectively. These data were showed in penal D and penal E. Panel F illustrated plasma leptin concentration of week 12 in the mice. Mean ± SEM (n=6–7/group), * P<0.05 and *** P<0.001 respectively LFD vs HFD. # P<0.05 and ## P<0.001, BM vs HFD.
Figure 4
Figure 4
Fatty acyl carnitine profiles were obtained by tandem mass spectrometry in muscle extracts from mice fed with low-fat (n=6, grey bars), high-fat diet (n=7, white bars) and BM extract supplementation (n=7, black bars). The effect of HFD and BM on short/medium chain (penal A) and long chain fatty acyl carnitine (penal B) was assessed by ANOVA as described in the methods. For each acyl carnitine subtype, C3, acrylylcarnitine; C4, butyrylcarnitine/isobutyrylcarnitine; C4DC, succinyl carnitine; C6, 3-hydroxy-cis-5-0ctenoyl carnitine; C8:1, octanoyl-L-carnitine; C12-DC, dodecenoyl-L-carnitine; C14-2, tetradecadienyl-L-carnitine; C14-OH, tetradecenoyl-L-carnitine; C16, hexadecanoyl-L-carnitine; C18-OH, 3-hydroxysteraroylcarnitine. Mean ± SEM, * P<0.05, ** P<0.01 and *** P<0.001 respectively HFD or BM vs LFD. # P<0.05 and ## P<0.01, BM vs HFD.
Figure 5
Figure 5
Effect of BM extract on insulin signaling pathway proteins in mice muscle tissues. IRS-1, IRS-2, IR β, PI3K, Akt1, Akt2 and GLUT4 in the muscle lysates were determined by western blotting. Panel A shows interested protein abundance in the muscle lysates. Results were normalized by β-actin. Panel B is the phosphorylation of IRS-1, Akt1 and Akt2 by normalized with corresponding protein levels. Panel C showed muscle PI 3 kinase activity in the mice. A 500 μg of muscle lysates was immunoprecipitated with anti-IRS-1 antibody and protein A agarose. IRS-1 associated PI 3K activity was measured by adding reaction buffer containing [r32P]ATP, PI and MgCl for 20 min, detail was described in the methods. Data are presented as mean ± SEM (n=6–7/group), * P<0.05, **P<0.01 and ***P<0.001, HFD or BM vs LFD. #P<0.05, ## P<0.01 and ### P<0.001 BM vs HFD respectively.
Figure 6
Figure 6
Glucose uptake and insulin signaling measurements in BM extract treated L6 myotubes. At day 6 post differentiation, cells were treated with various doses of BM extract showed in legends overnight (16 h). 2-D-glucose uptake was measured with [3H]-2-D-glucose assay and insulin signal transduction pathway protein contents were analyzed by western blotting. Panel A showed glucose uptake results. Panel B reveals insulin signaling protein abundance normalized by β-actin in BM treated L6 myotubes. Panel C illustrates that phosphorylation of IRS-1 and Akt1 normalized by IRS-1 and Akt1 protein levels respectively. Data were presented as mean ± SEM from three independent experiments. * P<0.05, ** P<0.01 and *** P<0.001, BM vs control respectively.

References

    1. Zimmet P, Alberti KG, Shaw J. Global and societal implications of the diabetes epidemic. Nature. 2001;414:782–787. - PubMed
    1. Reaven GM. Role of insulin resistance in human disease. Diabetes. 1998;37:1595–1607. - PubMed
    1. Hill JO, Wyatt HR, Reed GW, Peters JC. Obesity and the environment: where do we go from here? Science. 2003;299:853–855. - PubMed
    1. Basch E, Gabardi S, Ulbricht C. Bitter melon (Momordica charantia): A review of efficacy and safety. Am J Health-Syst Pharm. 2003;60:356–359. - PubMed
    1. McCarty MF. Does bitter melon contain an activator of AMP-activated kinase? Med Hypotheses. 2004;63:340–343. - PubMed

Publication types