. 2011 Apr 3;721(2):163-70.
doi: 10.1016/j.mrgentox.2011.01.009. Epub 2011 Jan 28.

When pigs fly: immunomagnetic separation facilitates rapid determination of Pig-a mutant frequency by flow cytometric analysis

Affiliations

When pigs fly: immunomagnetic separation facilitates rapid determination of Pig-a mutant frequency by flow cytometric analysis

Stephen D Dertinger et al. Mutat Res. .

Abstract

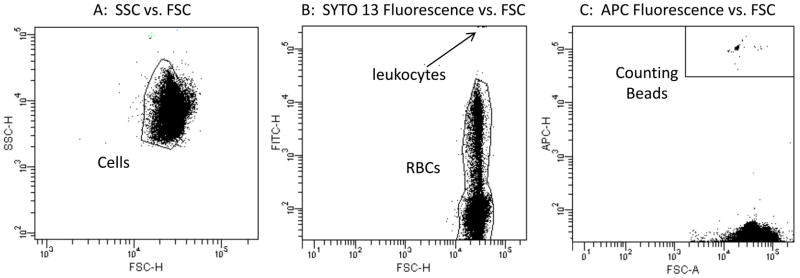
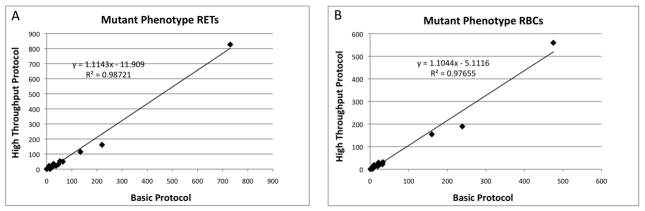
In vivo mutation assays based on the Pig-a null phenotype, that is, the absence of cell surface glycosylphosphatidylinositol (GPI) anchored proteins such as CD59, have been described. This work has been accomplished with hematopoietic cells, most often rat peripheral blood erythrocytes (RBCs) and reticulocytes (RETs). The current report describes new sample processing procedures that dramatically increase the rate at which cells can be evaluated for GPI anchor deficiency. This new method was applied to blood specimens from vehicle, 1,3-propane sultone, melphalan, and N-ethyl-N-nitrosourea treated Sprague Dawley rats. Leukocyte- and platelet-depleted blood samples were incubated with anti-CD59-phycoerythrin (PE) and anti-CD61-PE, and then mixed with anti-PE paramagnetic particles and Counting Beads (i.e., fluorescent microspheres). An aliquot of each specimen was stained with SYTO 13 and flow cytometric analysis was performed to determine RET percentage, RET:Counting Bead ratio, and RBC:Counting Bead ratio. The major portion of these specimens were passed through ferromagnetic columns that were suspended in a magnetic field, thereby depleting each specimen of wild-type RBCs (and platelets) based on their association with anti-PE paramagnetic particles. The eluates were concentrated via centrifugation and the resulting suspensions were stained with SYTO 13 and analyzed on the flow cytometer to determine mutant phenotype RET:Counting Bead and mutant phenotype RBC:Counting Bead ratios. The ratios obtained from pre- and post-column analyses were used to derive mutant phenotype RET and mutant phenotype RBC frequencies. Results from vehicle control and genotoxicant-treated rats are presented that indicate the scoring system is capable of returning reliable mutant phenotype cell frequencies. Using this wild-type cell depletion strategy, it was possible to interrogate ≥ 3 million RETs and ≥ 100 million RBCs per rat in approximately 7 min. Beyond considerably enhancing the throughput capacity of the analytical platform, these blood-processing procedures were also shown to enhance the precision of the measurements.


Figures

Figure 1
Figure 1
Schematic overview of the High Throughput Protocol. Platelet/leukocyte-depleted blood samples are first incubated with anti-CD59-PE in order to differentially label wild-type erythrocytes and mutant phenotype erythrocytes (PE-positive and PE-negative, respectively). Samples are then combined with anti-PE magnetic particles and Counting Beads, and then a small portion of each is stained with a nucleic acid dye and analyzed via flow cytometry to determine Pre-Column cell to Counting Bead ratios, as well as percent reticulocytes. The majority of each sample is passed over a column suspended in a magnetic field. Whereas the wild-type cells are largely retained in the column, mutant phenotype cells and Counting Beads are recovered in the eluate. Post-Column eluates are concentrated via centrifugation, stained with a nucleic acid dye, and analyzed via flow cytometry to determine mutant phenotype cell to Counting Bead ratios. Mutant phenotype cell frequencies are then derived from Pre- and Post-Column analyses.
Figure 2
Figure 2
Three bivariate graphs illustrate the gating logic used for the mutant scoring application described herein. In order for events to be considered an RBC and subject to evaluation of mutant phenotype versus wild-type phenotype status, they need to exhibit light scatter characteristics of cells (panel A), low/moderate SYTO 13-associated fluorescence consistent with erythrocytes and reticulocytes but not leukocytes (panel B), and low APC-associated fluorescence consistent with cells but not Counting Beads (panel C). Thus, while the Lympholyte reagent physically removes the bulk of platelets and leukocytes, and while Counting Beads are present in both Pre- and Post-Column specimens, this gating strategy ensures that mutant phenotype RET and RBC frequencies are not affected by these events.
Figure 3
Figure 3
Bivariate plots of representative nucleic acid dye (SYTO 13) versus anti-CD59-PE fluorescence profiles. Note that only erythrocytes, that is gated events, are shown. Key to quadrants: Upper right = wild-type reticulocytes; Lower right = wild-type mature erythrocytes; Upper left = mutant phenotype reticulocytes; Lower left = mutant phenotype mature erythrocytes. Plot A: Instrument calibration standard; mutant-mimicking cells (i.e., erythrocytes that were not incubated with anti-CD59-PE) were spiked into blood that was fully processed. This specimen provides enough events with a full range of fluorescence intensities to optimize PMT voltages and compensation settings on a daily basis. This calibration standard also provided a means for rationally and consistently setting the position of the vertical demarcation line that discriminates mutant phenotype erythrocytes from wild-type erythrocytes. Plot B: Blood from an ENU-treated rat, Pre-Column analysis; this blood sample was obtained from a rat twenty-five days after the last of three administrations of 40 mg ENU/kg/day. While 106 total erythrocytes were acquired, and there is some indication of a mutant response (events in the UL and LR quadrants), Pre-Column analyses were only used to determine reticulocyte frequency, reticulocyte to Counting Bead ratio, and total erythrocyte to Counting Bead ratio. Plot C: Blood from the same ENU-treated rat, Post-Column analysis; this sample was depleted of wild-type erythrocytes via immunomagnetic separation. With a subsequent centrifugation step, mutant phenotype cells become highly concentrated. The numbers of mutant phenotype reticulocytes and mutant phenotype erythrocytes are directly determined from this sample. Mutant phenotype cell frequencies require a denominator, that is, the total number of reticulcoytes and erythrocytes that were analyzed. These data were derived from the Pre-Column cell to bead ratios and the number of Counting Beads observed in the Post-Column sample. For this particular specimen, four minutes of Post-Column specimen data acquisition afforded the interrogation of 7.1 × 10⁶ reticulocyte and 107.2 × 10⁶ erythrocyte equivalents for the mutant phenotype.
Figure 4
Figure 4
Mutant phenotype cell frequencies derived from the High Throughput Protocol (Y-axis) are graphed against parallel analyses conducted according to the Basic Protocol (X-axis). N = 18; Panel A = mutant phenotype reticulocyte frequencies; Panel B = mutant phenotype erythrocyte frequencies; best-fit lines and associated r2 values are shown. High correlation coefficients and similarities in absolute frequency values indicate that the two methods yield similar results over a broad range of mutant cell frequencies.
Figure 5
Figure 5
Results from a reconstruction experiment are shown. Y-axis depicts the actual number of mutant phenotype cells scored, and the X-axis corresponds to the expected (relative) mutant cell content of each specimen, where 100 is the mutagen-treated animal (1,3-propane sultone), 0 is the vehicle control animal, and 14.3 and 28.9 correspond to 1:2.5 and 1:6 combinations of these blood samples, respectively. Each specimen was independently processed five times, and each individual measurement is plotted, and r2 values are shown. Panels A and B correspond to mutant phenotype erythrocyte and reticulocyte frequencies determined using the Basic Protocol, and Panels C and D correspond to analogous measurements made using the High Throughput Protocol. Samples that exhibited significantly different mutant phenotype cell frequencies relative to the control (0) specimen are indicted by asterisks (Dunnett’s test, p < 0.05).
Figure 6
Figure 6
Reticulocyte, mutant phenotype reticulocyte, and mutant phenotype erythrocyte frequencies following treatment with ENU are graphed. Panel A: average reticulocyte frequencies as a function of time relative to treatments that occurred on days 1, 2 and 3. Panel B: average mutant phenotype reticulocyte frequencies as a function of time. Panel C: average mutant phenotype erythrocyte frequencies as a function of time. All error bars are SEM. Note that Y-axis scales are different for mutant phenotype reticulocyte and mutant phenotype erythrocyte graphs. The higher responses observed in the reticulocyte subpopulation are expected over a 4 week experiment timeframe because the total erythrocyte pool has not completely turned over.)

References

    1. Takahashi M, Takeda J, Hirose S, Hyman R, Inoue N, Miyata T, Ueda E, Kitani T, Medof ME, Kinoshita T. Deficient biosynthesis of N-acetylglucosaminyl-phosphatidylinositol, the first intermediate of glycosyl phosphatidylinositol anchor biosynthesis, in cell lines established from patients with paroxysmal nocturnal hemoglobinuria. J Exp Med. 1993;177:517–512. - PMC - PubMed
    1. Kawagoe K, Takeda J, Endo Y, Kinoshita T. Molecular cloning of murine Pig-a, a gene for GPI-anchor biosynthesis, and demonstration of interspecies conservation of its structure, function, and genetic locus. Genomics. 1994;23:566–574. - PubMed
    1. Hernandez-Campo PM, Almeida J, Matarraz S, de Santiago M, Luz Sanchez M, Orfao A. Quantitative Analysis of the Expression of Glycosylphosphatidylinositol-Anchored Proteins During the Maturation of Different Hematopoietic Cell Compartments of Normal Bone Marrow. Cytometry. 2007;72B:34–42. - PubMed
    1. Bryce SM, Bemis JC, Dertinger SD. In Vivo Mutation Assay Based on the Endogenous Pig-a Locus. Environ Mol Mutagen. 2008;49:256–264. - PubMed
    1. Miura D, Dobrovolsky V, Kasahara Y, Katsuura Y, Heflich R. Development of an In Vivo Gene Mutation Assay Using the Endogenous Pig-A Gene: I. Flow Cytometric Detection of CD59-negative Peripheral Red Blood Cells and CD48-negative Spleen T-cells from the Rat. Environ Mol Mutagen. 2008;49:614–621. - PubMed

Publication types

Substances