. 2011 Apr;19(2):193-203.
doi: 10.1109/TNSRE.2011.2107750. Epub 2011 Jan 28.

Point-and-click cursor control with an intracortical neural interface system by humans with tetraplegia

Affiliations

Point-and-click cursor control with an intracortical neural interface system by humans with tetraplegia

Sung-Phil Kim et al. IEEE Trans Neural Syst Rehabil Eng. 2011 Apr.

Abstract

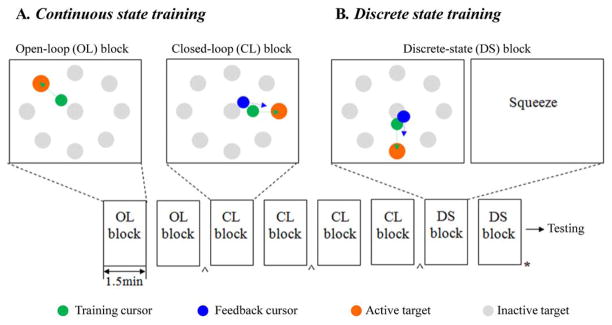
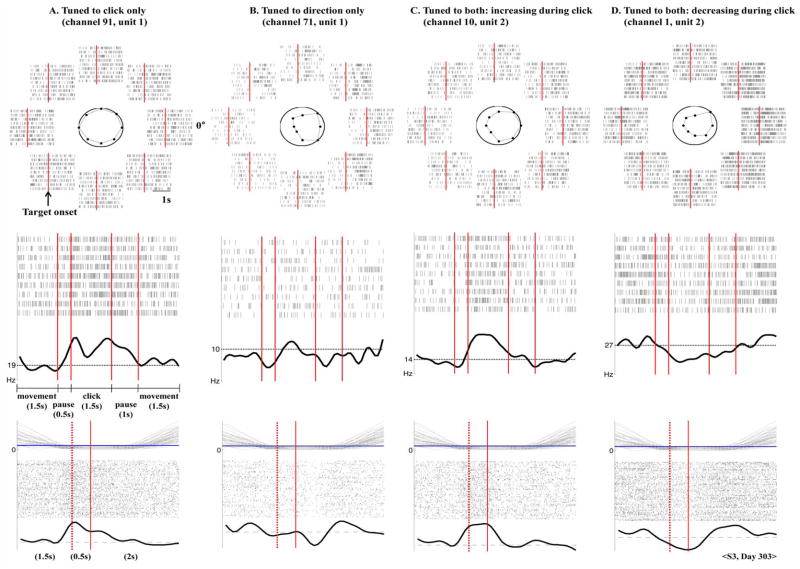
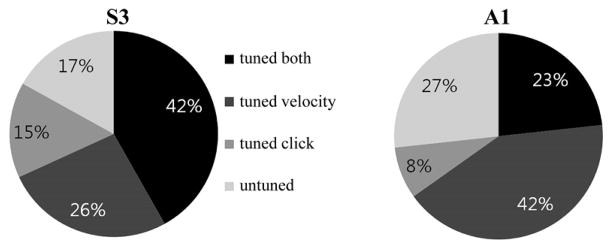
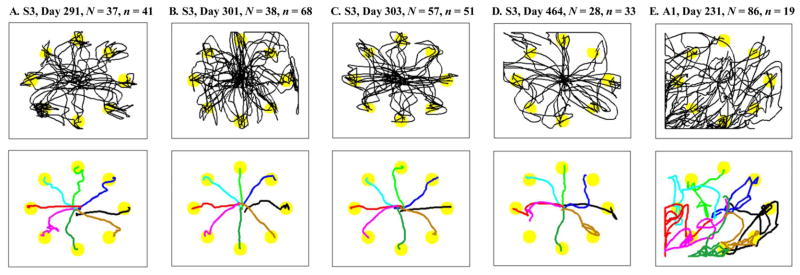
We present a point-and-click intracortical neural interface system (NIS) that enables humans with tetraplegia to volitionally move a 2-D computer cursor in any desired direction on a computer screen, hold it still, and click on the area of interest. This direct brain-computer interface extracts both discrete (click) and continuous (cursor velocity) signals from a single small population of neurons in human motor cortex. A key component of this system is a multi-state probabilistic decoding algorithm that simultaneously decodes neural spiking activity of a small population of neurons and outputs either a click signal or the velocity of the cursor. The algorithm combines a linear classifier, which determines whether the user is intending to click or move the cursor, with a Kalman filter that translates the neural population activity into cursor velocity. We present a paradigm for training the multi-state decoding algorithm using neural activity observed during imagined actions. Two human participants with tetraplegia (paralysis of the four limbs) performed a closed-loop radial target acquisition task using the point-and-click NIS over multiple sessions. We quantified point-and-click performance using various human-computer interaction measurements for pointing devices. We found that participants could control the cursor motion and click on specified targets with a small error rate (< 3% in one participant). This study suggests that signals from a small ensemble of motor cortical neurons (∼40) can be used for natural point-and-click 2-D cursor control of a personal computer.


Figures

Fig. 1
Fig. 1
Illustration of training paradigm. (A) Continuous state (CS) training was divided into OL and CL training blocks. See the text for details of OL and CL blocks. (B) DS training involved alternating continuous movement and “click action” within a block. See the text for details of DS blocks. (C) A typical sequence of training blocks is illustrated. The CS training phase began with two OL blocks (each for 1.5 min) followed by four CL blocks (each 1.5 min). Then, the DS training phase used two DS blocks (each 1.5 min). The symbol ^ indicates training/updating the CS decoder and * indicates training the DS decoder. The time between blocks was < 1 min.
Fig. 2
Fig. 2
Neuronal firing patterns related to cursor movement and click. Raster plots of spiking activity of four units (recorded on day 303, S3) represent four different types of neuronal firing behaviors: (A) firing rate varied with click training only; (B) firing rate varied with TC direction only; (C) and (D) firing rate varied with both click motion and the TC direction by increasing the rate (C) or decreasing the rate (D) during click. (top) For each TC movement direction, 10 spike trains are shown beginning 1 s before target onset (vertical bar) to 1.5 s after onset. The octagons in the center circle illustrate the mean firing rates for each direction during 1.5 s after target onset. (middle) The raster plots show 10 spike trains recorded during click training in which the participant (S3) imagined squeezing the hand. The sequence of click training is described in the text (see Section II-B). Below each raster plot, the smoothed version of the peri-stimulus time histogram (PSTH) is shown. Black horizontal dashed lines indicate the mean firing rate estimated from the training data. (bottom) The spiking activity during the closed-loop point-and-click target acquisition task is shown for 48 successful target acquisition runs for all eight directions. The top plot shows the temporal variation of the distance from the NC to the target for each run. The horizontal line indicates a distance within which the NC overlapped a target. The middle spike raster plots are aligned from 2 s before to 2 s after target acquisition (the second vertical bar). The target was acquired when the click was continuously decoded over a 0.5 s interval during which the NC overlapped the target. The dashed bar indicates the start of decoding the click state 0.5 s before generating the actual click signal. The bottom plot shows the smoothed PSTH. Black horizontal dashed lines indicate the mean firing rate observed in the training data.
Fig. 3
Fig. 3
Percentage of neuronal units with different tuning properties. The variability in tuning properties of neuronal units, recorded over four sessions in S3 and one session in A1, is shown. These include: tuned to both cursor velocity and click; tuned to velocity only; tuned to click only; or tuned to neither velocity nor click.
Fig. 4
Fig. 4
The NC movement paths. Individual NC movement paths made from the onset of target appearance to target acquisition (successful or failed) are illustrated by black lines. Circles approximately represent the target location and size (visual angle 2.6°). Below each plot of the NC paths are the mean NC paths to each target. Different lines denote the mean path for each of eight targets. The number of neuronal units (N) used for controlling the NC and the number of target acquisition runs (n) are marked.
Fig. 5
Fig. 5
Click generation as a function of distance to the target. The NC location when a click was generated is compared with its distance to the target. (A) A scatter plot of the NC locations with respect to the target is shown for all successful clicks (blue dots) and false clicks (orange dots). 193 click location samples are shown for S3 and 16 samples for A1. The circle represents the area around the target within which the NC overlapped the target (i.e., the target was selectable). The square represents the center of the screen. (B) The normalized histogram of the distance to the target for all successful (blue) and false (orange) clicks (the bin width was 39 pixels). (C) The normalized histogram of the distance at which the first click occurred in each target acquisition run.
Fig. 6
Fig. 6
Histograms of the preferred direction and the false-click-related movement direction. (A) Polar histograms of the intended direction of the NC movement at the point when false clicks were generated are shown for eight angular bins centered at {0°,45°,…, 315°}. 138 false click events were analyzed for S3 and 19 for A1. (B) Polar histograms of the preferred direction (PD) of the “multi-state tuned” units that were tuned to both click and direction. The histogram for 61 multi-state tuned units is shown for S3 (15 units for A1).

References

    1. Serruya MD, Hatsopoulos NG, Paninski L, Fellows MR, Donoghue JP. Instant neural control of a movement signal. Nature. 2002;416:141–142. - PubMed
    1. Taylor DM, Tillery SIH, Schwartz AB. Direct cortical control of 3D neuroprosthetic devices. Science. 2002;296:1829–1832. - PubMed
    1. Carmena JM, et al. Learning to control a brain-machine interface for reaching and grasping by primates. PLoS Biol. 2003;1:192–208. - PMC - PubMed
    1. Musallam S, Corneil BD, Greger B, Scherberger H, Andersen RA. Cognitive control signals for neural prosthetics. Science. 2004;305:258–262. - PubMed
    1. Santhanam G, Ryu SI, Yu BM, Afshar A, Shenoy KV. A high-performance brain-computer interface. Nature. 2006;442:195–198. - PubMed

Publication types