. 2011 Jan;23(1):381-95.
doi: 10.1105/tpc.110.075390. Epub 2011 Jan 28.

Heterodimers of the Arabidopsis transcription factors bZIP1 and bZIP53 reprogram amino acid metabolism during low energy stress

Affiliations

Heterodimers of the Arabidopsis transcription factors bZIP1 and bZIP53 reprogram amino acid metabolism during low energy stress

Katrin Dietrich et al. Plant Cell. 2011 Jan.

Abstract

Control of energy homeostasis is crucial for plant survival, particularly under biotic or abiotic stress conditions. Energy deprivation induces dramatic reprogramming of transcription, facilitating metabolic adjustment. An in-depth knowledge of the corresponding regulatory networks would provide opportunities for the development of biotechnological strategies. Low energy stress activates the Arabidopsis thaliana group S1 basic leucine zipper transcription factors bZIP1 and bZIP53 by transcriptional and posttranscriptional mechanisms. Gain-of-function approaches define these bZIPs as crucial transcriptional regulators in Pro, Asn, and branched-chain amino acid metabolism. Whereas chromatin immunoprecipitation analyses confirm the direct binding of bZIP1 and bZIP53 to promoters of key metabolic genes, such as ASPARAGINE SYNTHETASE1 and PROLINE DEHYDROGENASE, the G-box, C-box, or ACT motifs (ACTCAT) have been defined as regulatory cis-elements in the starvation response. bZIP1 and bZIP53 were shown to specifically heterodimerize with group C bZIPs. Although single loss-of-function mutants did not affect starvation-induced transcription, quadruple mutants of group S1 and C bZIPs displayed a significant impairment. We therefore propose that bZIP1 and bZIP53 transduce low energy signals by heterodimerization with members of the partially redundant C/S1 bZIP factor network to reprogram primary metabolism in the starvation response.


Figures

Figure 1.
Figure 1.
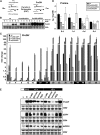
Analysis of bZIP1 and bZIP53 in the Low Energy Response. (A) Expression of bZIP1 and bZIP53 increases after extended night treatment. Wild-type plants are cultivated at a day/night cycle of 16/8 h as indicated by the scheme. Day, night, and extended night phases are indicated by white, black, and gray bars, respectively. Transcript abundance as determined by qPCR is presented for bZIP1 (black bars) and bZIP53 (white bars). Rosette leaves of 10 3-week-old plants were pooled and used for RNA preparation and qPCR at the time points indicated. Fold change compared with wild-type expression is depicted at 0 h. Mean value and sd of two replicates are given. (B) Histochemical GUS staining of transgenic plants expressing Pro-bZIP1:GUS (top panel) and ProbZIP53:GUS (bottom panel). The upstream regions of the constructs expressed in these plants (diagram above) contain the conserved system of uORFs (depicted by rectangles) that mediates sucrose-dependent posttranslational repression (Wiese et al., 2005; Weltmeier et al., 2009). GUS staining of plants grown under a 16/8-h day/night cycle (0 h) or darkness for 48 and 120 h is shown. (C) Three-week-old plants expressing bZIP1 under control of the 35S promoter (Pro35S:bZIP1), the wild type (wt), bzip1, and the bzip1 bzip53 double mutant were analyzed for an enhanced senescence phenotype after 6 d in the dark. (D) Relative chlorophyll content of rosette leaves of Pro35:bZIP53 and the plants depicted in (C). Plants were cultured in a normal day/night cycle (white bars) or for extended dark treatment as indicated. Significance was tested by one-way analysis of variance (ANOVA) analysis following Fisher’s LSD post-test, P < 0.05.
Figure 2.
Figure 2.
bZIP1 and bZIP53 Regulate ProDH Transcription and Pro Content during Dark Treatment. (A) The ProDH enzyme regulates catabolism of the amino acid Pro to pyrrolin-5-carboxylate (P5C). Given is the complementary biosynthesis pathway based on Glu and making use of P5C as intermediate (Hellmann et al., 2000). (B) RNA gel blot analysis of ProDH in the wild type (wt), Pro35S:bZIP1 (line C), and Pro35S:bZIP53 (line 10) (Weltmeier et al., 2006) in response to long-term dark treatment for 1 to 8 d. Plant material was harvested late in the afternoon (5 pm). (C) Analysis of ProDH transcript accumulation in the wild type (black bars), Pro35S:bZIP1 (gray bars), Pro35S:bZIP53 (hatched bars), and bzip1 bzip53 (white bars) plants after short-term dark treatment as described in Figure 1A. Rosette leaves of 10 3-week-old plants were pooled and used for RNA preparation and qPCR at the time points indicated. Fold change compared with wild-type expression is depicted at 0 h. Mean value and sd of two replicates are given. Expression analysis of bZIP1 and bZIP53 is provided in Supplemental Figure 4 online. For visualizing the differences in transcript levels, the y axis is broken twice, at 1.5- and 30-fold induction. (D) Quantification of Pro levels of the plants described in (B) and (C) after dark treatment. Given are ng Pro/mg dry weight (DW) as mean values and sd of two independent repetitions. Asterisks represent significant differences between wild-type, overexpressor, and mutant plants at the indicated time points (two-way ANOVA; *P < 0.05 and ***P < 0.001). (E) The transcript abundance of bZIP1 and bZIP53 is regulated by sugar depletion. Three-week-old wild-type plants were cultivated in hydroponic culture as depicted in the scheme. Plants were harvested 3 h after the beginning of the light period (L). The remaining plants were incubated in darkness for 24 h (D). After 24 h, the plants were transferred to medium containing equimolar (167 mM) 3-oMG, glucose, sucrose, and PEG1000 or nonsupplemented medium as control (−). During these incubations, plants were kept in the dark. RNA was isolated from the differently supplemented cultures after 1 or 2 h, respectively. Given are RNA gel blot analyses of ProDH, bZIP1, and bZIP53 transcripts. Loading is controlled by ethidium bromide (EtBr) staining.
Figure 3.
Figure 3.
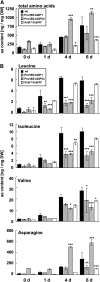
Quantitative Analysis of the Amount of Amino Acids in Dark-Treated Plants. The levels of total amino acid content (A) and of Leu, Ile, Val, and Asn (B). Amino acid levels of the wild type (wt) (black bars), Pro35S:bZIP1 (gray bars), Pro35S:bZIP53 (hatched bars), and bzip1 bzip53 (white bars) after 0, 1, 4, and 6 d of dark treatment are calculated as ng amino acid/mg dry weight (DW). Given are mean values and sd of two independent experiments. Asterisks represent significant differences between wild-type, overexpressor, and mutant plants at the indicated time points (two-way ANOVA; *P < 0.05, **P < 0.01, and ***P < 0.001).
Figure 4.
Figure 4.
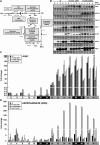
bZIP1 and bZIP53 Regulate Gene Expression of Asn Metabolism during Extended Night Treatment. (A) The Asn biosynthesis pathway according to Lin and Wu (2004). αKG, α-keto-glutarate; Pyr, pyruvate; PEP, phosphoenolpyruvate; PPDK, pyruvate orthophosphate dikinase. (B) RNA gel blot analysis of the indicated genes corresponding to the enzymatic steps depicted in the Asn biosynthesis pathway in (A) after long-term dark treatment for 0 to 8 d. Compared are wild-type (wt), Pro35S:bZIP1, and Pro35S:bZIP53 plants. During dark induction, plants were harvested at the indicated days at 5 pm. As a loading control, ethidium bromide stainings are provided for each hybridization experiment. (C) and (D) Induction of ASN1 (C) or ANS (D) after short-term dark treatment. Rosette leaves of 10 3-week-old plants were pooled and used for RNA preparation and qPCR at the time points indicated. Fold change compared with wild-type expression is depicted at 0 h. Mean value and sd of two replicates are given. The wild type (black bars), Pro35S:bZIP1 (gray bars), Pro35S:bZIP53 (hatched bars), and bzip1 bzip53 (white bars) analyzed by qPCR as described in Figure 1A. For visualizing the differences in transcript levels of ASN1, the y axis is broken twice, at two- and 140-fold induction. The y axis of the ANS plot is broken once at 10-fold induction.
Figure 5.
Figure 5.
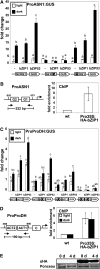
bZIP1 Binds Directly to the ASN1 and ProDH Promoters and Mediates Starvation Responses via G-Box (CACGTG) or ACTCAT cis-Elements. (A) Arabidopsis protoplasts were transformed with a ProASN1:GUS reporter construct or the indicated promoter mutations (see diagrams beneath the x axis). After cotransformation with the effector plasmids (Pro35S:bZIP1 or Pro35S:bZIP53), reporter induction was compared in constant darkness (black bars) or in constant light (white bars) conditions. Given is the fold change with respect to the empty vector control experiment without any bZIP construct added (−) under constant light. Four transfection experiments were used to calculate mean values and sd. Significance was tested by one-way ANOVA analysis following Tukey’s post-test (P < 0.05). (B) Direct binding of bZIP1 to the ASN1 promoter as demonstrated by ChIP. ASN1 promoter structure and primer binding sites are indicated on the left. Chromatin extracts from wild-type (wt) plants and Pro35S:HA-bZIP1 were subjected to qPCR analysis with ASN1 promoter-specific primers after immunoprecipitation with an anti-HA antibody (α-HA). Ct values for Pro35S:HA-bZIP1 samples were subtracted from the Ct values of the equivalent wild type. For normalization, an actin (ACT7) gene was used. Calculated are induction levels with respect to the wild-type samples. Given are mean values and sd of three independent experiments. (C) Analysis of the ProProDH:GUS constructs as described in (A). Additional promoter analyses are provided in Supplemental Figure 8 online. (D) ChIP experiment of wild-type and Pro35S:HA-bZIP1 plants as described in (B). Chromatin was isolated from 3-week-old plants grown under normal light/dark cycle (white bars) or plants cultivated in an extended night for 4 d (black bars). Given are mean values and sd of three repetitions. (E) Immunoblot analysis of chromatin derived from wild-type and Pro35S:HA-bZIP1 plants detected with an αHA antibody indicates a comparable HA-bZIP1 protein abundance in light- and dark-treated plants. As a loading control, Ponceau staining of the protein preparation is given (bottom panel).
Figure 6.
Figure 6.
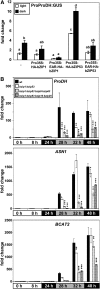
Impact of bZIP Factors on Target Gene Expression Using bZIP-Specific Loss-of-Function Approaches. (A) EAR repressor fusions of bZIP1 and bZIP53 reveal a regulatory function in dark-induced ProDH transcription. Arabidopsis protoplasts were transiently transformed with a ProProDH:GUS reporter and cotransfected with Pro35S-driven reporters (HA-bZIP1, HA-bZIP53, HA-EAR-bZIP1, and HA-EAR-bZIP53). Induction by cultivation in constant dark (black bars) conditions is compared with expression in constant light (white bars). Depicted is the fold change compared with the promoter in the light. Four transfection experiments were used to calculate mean values and sd. Different letters indicate significant differences, tested by one-way ANOVA analysis following Tukey’s post-test (P < 0.05). Expression of the effector constructs was confirmed by immunoblot analysis (see Supplemental Figure 9A online). (B) qPCR analysis of ProDH, ASN1, and BCAT2 after extended night treatment as described in Figure 1. Rosette leaves of 10 3-week-old plants were pooled and used for RNA preparation and qPCR at the indicated time points. Fold change compared with the wild type (wt) is indicated at 0 h. Mean value and sd of two replicates are given. Asterisks represent significant differences between wild-type and mutant plants at the indicated time points (two-way ANOVA; *P < 0.05, **P < 0.01, and ***P < 0.001). Impaired expression of the corresponding bZIP genes is demonstrated in Supplemental Figures 9B and 9C online.
Figure 7.
Figure 7.
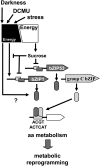
Model Summarizing the Function of bZIP Factors in the Energy Deprivation Response. Starvation activates bZIP1 and bZIP53 transcriptionally and posttranscriptionally, the latter by a conserved system of uORFs. Presumably by heterodimerization with other members of the C/S1 bZIP network, bZIP1 and bZIP53 initiate a change in transcriptional activity by binding to ACGT or ACTCAT-like cis-elements within the promoters of metabolic target genes, causing a reprogramming of primary metabolism in response to low energy stress.

References

    1. Alonso R., Oñate-Sánchez L., Weltmeier F., Ehlert A., Diaz I., Dietrich K., Vicente-Carbajosa J., Dröge-Laser W. (2009). A pivotal role of the basic leucine zipper transcription factor bZIP53 in the regulation of Arabidopsis seed maturation gene expression based on heterodimerization and protein complex formation. Plant Cell 21: 1747–1761 - PMC - PubMed
    1. Baena-González E., Rolland F., Thevelein J.M., Sheen J. (2007). A central integrator of transcription networks in plant stress and energy signalling. Nature 448: 938–942 - PubMed
    1. Baena-González E., Sheen J. (2008). Convergent energy and stress signaling. Trends Plant Sci. 13: 474–482 - PMC - PubMed
    1. Bruneau L., Chapman R., Marsolais F. (2006). Co-occurrence of both L-asparaginase subtypes in Arabidopsis: At3g16150 encodes a K+-dependent L-asparaginase. Planta 224: 668–679 - PubMed
    1. Buchanan-Wollaston V., Page T., Harrison E., Breeze E., Lim P.O., Nam H.G., Lin J.F., Wu S.H., Swidzinski J., Ishizaki K., Leaver C.J. (2005). Comparative transcriptome analysis reveals significant differences in gene expression and signalling pathways between developmental and dark/starvation-induced senescence in Arabidopsis. Plant J. 42: 567–585 - PubMed

MeSH terms

Substances