. 2011 May;39(10):4450-63.
doi: 10.1093/nar/gkr025. Epub 2011 Jan 28.

Mapping interactions between the RNA chaperone FinO and its RNA targets

Affiliations

Mapping interactions between the RNA chaperone FinO and its RNA targets

David C Arthur et al. Nucleic Acids Res. 2011 May.

Abstract

Bacterial conjugation is regulated by two-component repression comprising the antisense RNA FinP, and its protein co-factor FinO. FinO mediates base-pairing of FinP to the 5'-untranslated region (UTR) of traJ mRNA, which leads to translational inhibition of the transcriptional activator TraJ and subsequent down regulation of conjugation genes. Yet, little is known about how FinO binds to its RNA targets or how this interaction facilitates FinP and traJ mRNA pairing. Here, we use solution methods to determine how FinO binds specifically to its minimal high affinity target, FinP stem-loop II (SLII), and its complement SLIIc from traJ mRNA. Ribonuclease footprinting reveals that FinO contacts the base of the stem and the 3' single-stranded tails of these RNAs. The phosphorylation or oxidation of the 3'-nucleotide blocks FinO binding, suggesting FinO binds the 3'-hydroxyl of its RNA targets. The collective results allow the generation of an energy-minimized model of the FinO-SLII complex, consistent with small-angle X-ray scattering data. The repression complex model was constrained using previously reported cross-linking data and newly developed footprinting results. Together, these data lead us to propose a model of how FinO mediates FinP/traJ mRNA pairing to down regulate bacterial conjugation.


Figures

Figure 1.
Figure 1.
Overview of constructs used in the study. (A and B) The secondary structures of traJ mRNA and FinP, respectively. The ribosomal binding site and start codon of traJ mRNA are boxed. The derivative RNAs of focus, SLIIc and SLII, are shown in bold and numbered accordingly. (C) The secondary structure SLII LV1 RNA, used to form a complex with the FinO45–186 in the SAXS experiments. SLII LV1 deviates from wild-type SLII in its loop region, which is shown in bold. (D) The crystal structure of FinO26–186 highlighting the protein constructs used in the experiments. The W36A mutation is shown as a ball on the structure. The N-terminal 32 amino acids were not observed due to disorder in the structure and are drawn in (dashed section). Below is a scaled linear representation of the primary structure of FinO showing where each construct begins. The shades of gray correspond to the crystal structure coloring. (E) A representative 8% native PAGE demonstrating each of the FinO constructs in a 1:1 molar complex with 5′-32P-SLII.
Figure 2.
Figure 2.
RNase V1 cleavage of 5′- and 3′-end-labeled SLII in the absence and presence of various FinO constructs. (A) 15% urea-denaturing polyacrylamide gels showing the products of RNase V1 (0.001 U/µl final concentration) cleavage reactions. M10 and M15 are synthesized SLII RNA markers of 10 and 15 nucleotides in length (see ‘Materials and Methods’ section). The lanes OH and T1 represent the alkaline hydrolysis and RNase T1 cleavage of denatured SLII, respectively. SLII nucleotide positions are indicated at the right of the gels. Large and small arrowheads indicate major or minor cleavages by RNase V1 in the presence of FinO. Vertical brackets represent significant footprints on SLII RNA resulting from FinO protection of SLII from RNase V1 attack. (B) Bar graphs showing the quantification of the footprint areas of the gels in (A). The left axis shows the degree of FinO protection from RNase V1 relative to the ‘No protein’ reaction. In black is FinO1–186 WT, white is FinO33–186 W36A, and in gray is FinO45–186. Data above the horizontal dashed rule in each graph represent significant protection (≥2-fold) by FinO. The black bars below the x-axis highlight the footprint. The shift in the footprint when 5′- and 3′-end-labeling are compared is likely due to the effect of adding pCp to the 3′-end of the RNA when 3′-end-labeling. In Figure 6, we demonstrate that this subtly alters protein binding.
Figure 3.
Figure 3.
RNase V1 cleavage of 5′- and 3′-end-labeled SLIIc in the absence and presence of various FinO constructs. (A) 15% urea-denaturing polyacrylamide gels showing the products of RNase V1 (0.01 U) cleavage reactions. The lanes OH and T1 represent the alkaline hydrolysis and RNase T1 cleavage of denatured SLIIc, respectively. SLIIc nucleotide positions are indicated at the right of the gels. Large and small arrowheads indicate major or minor cleavages by RNase V1 in the presence of FinO. Vertical brackets represent significant footprints on SLIIc RNA resulting from FinO protection of SLIIc from RNase V1 attack. The asterisk at position C10 marks very weak protection of the lower stem at the 5′-end of SLIIc. (B) Bar graphs showing the quantification of the footprint areas of the gels in (A). The left axis shows the degree of FinO protection from RNase V1 relative to the ‘No protein’ reaction. In black is FinO1–186 WT, white is FinO33–186 W36A, and in gray is FinO45–186. Data above the horizontal dashed rule in each graph represent significant protection (≥2-fold) by FinO. The black bars below the x-axis highlight the footprint.
Figure 4.
Figure 4.
Limited RNase I digestion of 5′- and 3′-end-labeled SLII and SLIIc in the absence and presence of various FinO constructs. Products of the RNase I (0.01 U/µl final concentration) cleavage reactions were resolved on 15% urea-denaturing polyacrylamide gels. The radiolabeled RNA construct is noted below each of the gels. The lanes OH and T1 represent the alkaline hydrolysis and RNase T1 cleavage of denatured SLII or SLIIc, respectively. The RNA nucleotide positions are indicated at the left of the gels. Large and small arrowheads indicate major or minor cleavages by RNase I in the presence of FinO while the vertical bracket indicates protection from RNase I.
Figure 5.
Figure 5.
RNase I overdigestion of 5′- and 3′-end-labeled SLII and SLIIc in absence and presence of various FinO constructs. In all experiments, the RNAs were digested with RNase I at a final concentration of 0.1 U/µl. (Ai) A 8% native EMSA showing binding reactions of 5′-32P-SLII with increasing amounts of wild-type FinO before the addition of RNase I. The final concentration of FinO WT in micromolar in each reaction is indicated on top of the gel. (Aii) Slice from a 15% urea-denaturing gel showing the products of the RNase I digest of 5′-32P-SLII at the 3′-end in the presence of increasing amounts of FinO. The lanes correspond to the binding reactions in (Ai). The lanes OH and T1 represent the alkaline hydrolysis and RNase T1 cleavage of denatured 5′-32P-SLII, respectively. SLII nucleotide positions are indicated at the right of the gel. (B) Slice from a 15% urea-denaturing gel showing the products of the RNase I digest of 5′-32P-SLIIc at the 3′-end in the absence and presence of various FinO constructs. Nucleotide position G39 is indicated next to the gel. (C) Slice from a 15% urea-denaturing gel showing the products of the RNase I digest of 3′-32P-SLIIc at the 5′-end in the absence and presence of various FinO constructs. SLIIc nucleotide positions are indicated next to the gel. (D) Slice from a 15% urea-denaturing gel showing the products of the RNase I digest of 3′-32P-SLII at the 5′-end in the absence and presence of various FinO constructs. Nucleotide position G5 is indicated at the right of the gel. For experiments in (B–D), a 1:1 molar ratio FinO-RNA complex was formed prior to exposure to RNase I.
Figure 6.
Figure 6.
FinO binding to SLII requires a terminal 3′-OH on the 3′-tail of SLII. Native gels (8%) of binding reactions between FinO constructs and SLII RNA derivatives. (A) FinO does not bind SLII RNA containing a 3′,5′-cytidine diphosphate 3′-terminus. T4 RNA ligase I was used to ligate 3′,5′-cytidine [5′-32P] disphosphate (pCp) to the 3′-tail resulting in a 3′-phosphate. NP, no protein. Triangles represent increasing concentrations of FinO or the indicated mutants: 0.25, 0.5, 1, 2.5, 5 and 10 µM. The positions of free 32P-SLII and the FinO-32P-SLII are noted by arrows. (B) Treatment of SLII RNA containing a 3′,5′-cytidine diphosphate 3′-terminus to give a 2′,3′ cis-diol (3′-hydroxyl) restores FinO binding. (C) Oxidation of SLII with sodium periodate to give a 2′,3′ dialdehyde reduces binding affinity. The protein concentrations were 1 µM in each of the binding reactions in B and C.
Figure 7.
Figure 7.
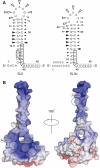
Summary of RNase V1 and I cleavage reactions of SLII and SLIIc. (A) Secondary structures of SLII and SLIIc showing the results from the RNase cleavage reactions. Large and small black arrowheads denote strong and weak RNase V1 cleavages, respectively in the presence of the FinO constructs. Large and small open arrowheads denote strong and weak RNase I cleavages, respectively in the presence of FinO. Boxes indicate footprints where FinO protected the RNAs from RNase V1 cleavage. Dashed boxes indicate areas of protection from RNase I cleavage by FinO. An area where a ‘V’ resides indicates enhanced cleavage by RNase I in the presence of the FinO constructs. (B) Electrostatic potentials at the solvent accessible surface of FinO33–184, contoured at ±10 kT/e. Approximate surface locations of the six FinO side-chains known to cross-link to SLII are labeled and shown with semi-transparent circles.
Figure 8.
Figure 8.
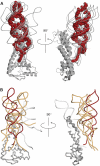
Combining HADDOCK and SAXS to model FinO45–186: SLII. Pair-wise RMSD cluster analysis was performed on the top 250 models ordered on χ2. Five clusters were obtained using an RMSD cutoff of 13 Å. (A) Model complexes from the best cluster (mean χ2 for nine members, 4.1) are shown in gray. The average structure for this cluster as calculated using THESEUS is represented with red spheres. (B) The average structures for all five clusters are shown superimposed. The average structure for the best cluster shown in (A) is shown as a red ribbon, and that of a significant structural outlier in white.
Figure 9.
Figure 9.
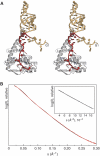
Representative FinO45–186:SLII model. (A) Shown in stereo, a cartoon representation of one of the individual FinO–SLII complexes from the cluster analysis. Nucleotides 7, 8 and 34–45, which are protected from RNase I and VI cleavage upon complex formation, are shown in red. Side-chains of cross-linking residues Arg121, Lys125, Arg165 and Lys176 are all within contact distance of the single-stranded 3′-tail. (B) The theoretically calculated small-angle X-ray scattering curve (black) of the model shown in (A) fits the experimental data curve (red) with a χ2 of 4.2. Inset, the Guinier plot of experimental data points 2–36 (s.RG 0.61–1.29), the linear nature of which indicates a lack of aggregation in the sample.

References

    1. Ippen-Ihler KA, Minkley EG., Jr The conjugation system of F, the fertility factor of Escherichia coli. Annu. Rev. Genet. 1986;20:593–624. - PubMed
    1. Frost LS, Ippen-Ihler K, Skurray RA. Analysis of the sequence and gene products of the transfer region of the F sex factor. Microbiol. Rev. 1994;58:162–210. - PMC - PubMed
    1. Finnegan D, Willetts N. The nature of the transfer inhibitor of several F-like plasmids. Mol. Gen. Genet. 1972;119:57–66. - PubMed
    1. Finnegan D, Willetts N. The site of action of the F transfer inhibitor. Mol. Gen. Genet. 1973;127:307–316. - PubMed
    1. Gaffney D, Skurray R, Willetts N. Regulation of the F conjugation genes studied by hybridization and tra-lacZ fusion. J. Mol. Biol. 1983;168:103–122. - PubMed

Publication types

MeSH terms