. 2011 May;39(10):4284-99.
doi: 10.1093/nar/gkq1224. Epub 2011 Jan 28.

TEFM (c17orf42) is necessary for transcription of human mtDNA

Affiliations

TEFM (c17orf42) is necessary for transcription of human mtDNA

Michal Minczuk et al. Nucleic Acids Res. 2011 May.

Abstract

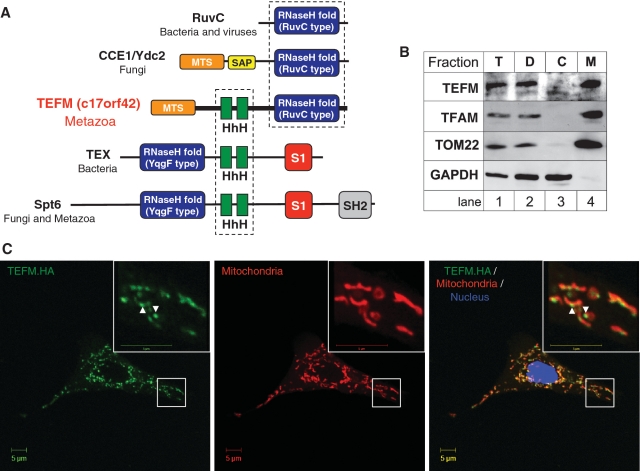
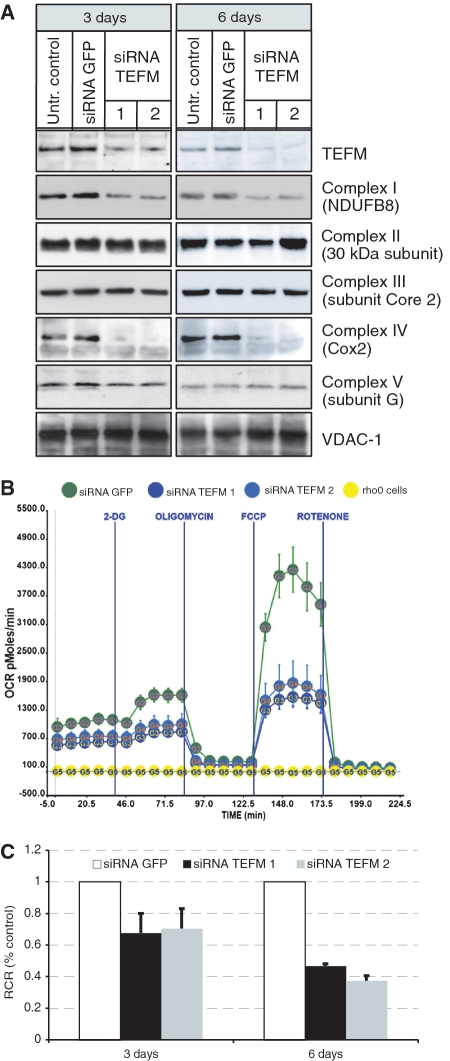
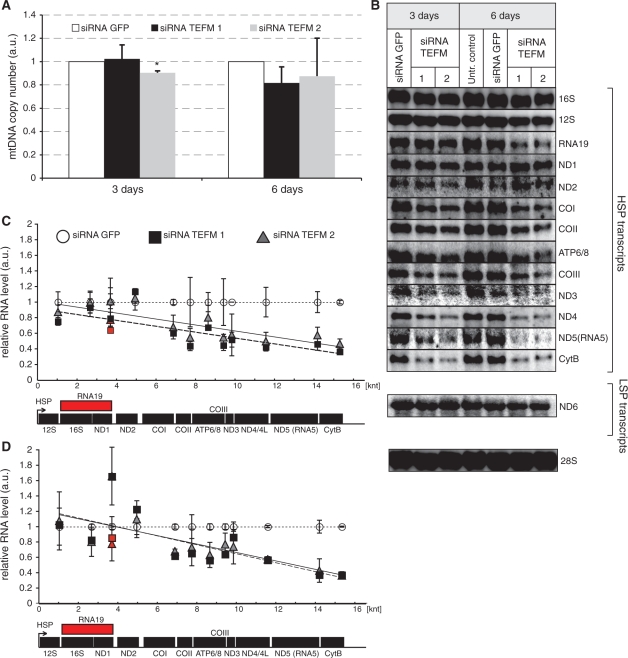
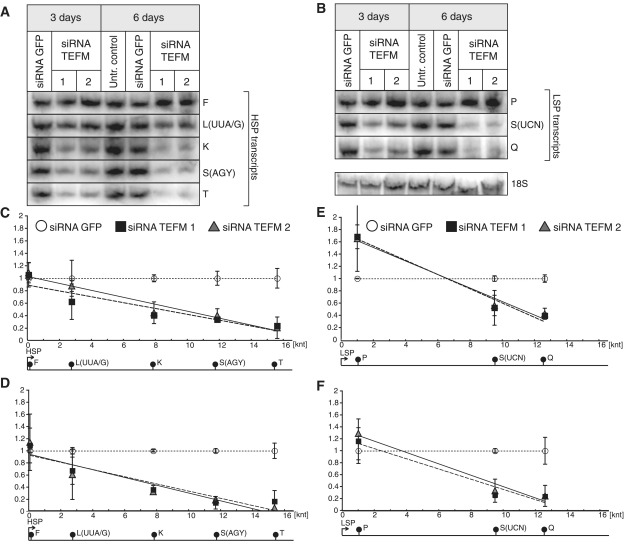
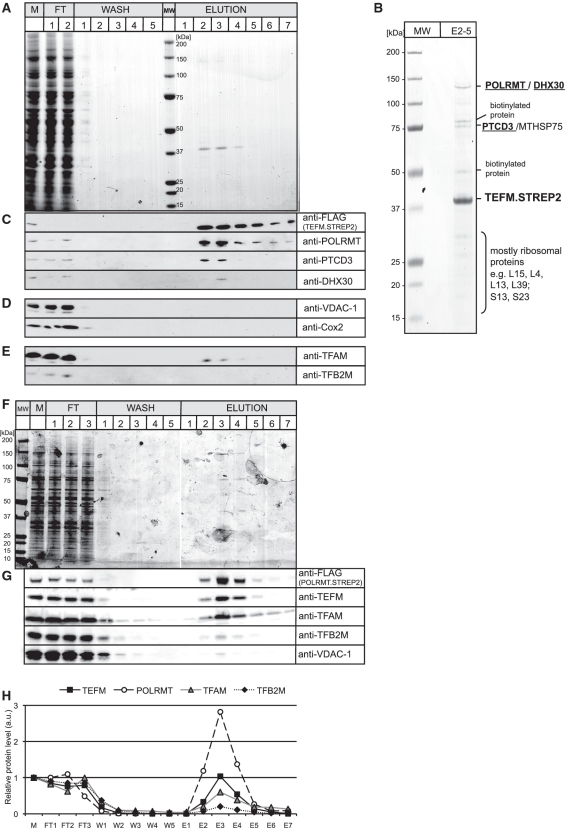
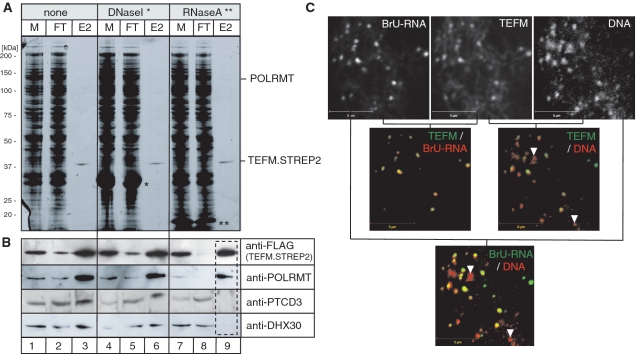
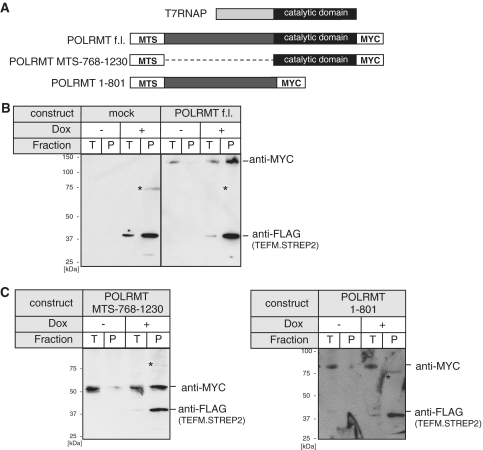
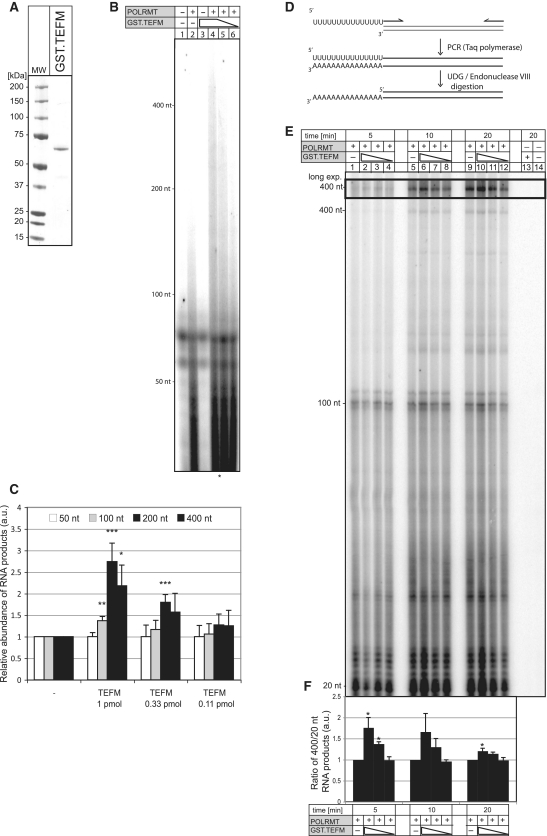
Here we show that c17orf42, hereafter TEFM (transcription elongation factor of mitochondria), makes a critical contribution to mitochondrial transcription. Inactivation of TEFM in cells by RNA interference results in respiratory incompetence owing to decreased levels of H- and L-strand promoter-distal mitochondrial transcripts. Affinity purification of TEFM from human mitochondria yielded a complex comprising mitochondrial transcripts, mitochondrial RNA polymerase (POLRMT), pentatricopeptide repeat domain 3 protein (PTCD3), and a putative DEAD-box RNA helicase, DHX30. After RNase treatment only POLRMT remained associated with TEFM, and in human cultured cells TEFM formed foci coincident with newly synthesized mitochondrial RNA. Based on deletion mutants, TEFM interacts with the catalytic region of POLRMT, and in vitro TEFM enhanced POLRMT processivity on ss- and dsDNA templates. TEFM contains two HhH motifs and a Ribonuclease H fold, similar to the nuclear transcription elongation regulator Spt6. These findings lead us to propose that TEFM is a mitochondrial transcription elongation factor.


Figures

Figure 1.
Figure 1.
In silico identification and mitochondrial localization of TEFM. (A) Domain architecture of proteins homologous to TEFM. Green blocks indicate the tandem helix-hairpin-helix domains (HhH, Pfam PF00633) found in transcription related and DNA binding proteins. The RuvC and YqgF (Pfam PF03652) motifs (blue) exhibit the typical topology and structural elements of the RNase H fold. S1 domain (red) typically binds RNA whereas the SH2 domain (grey) is found in many proteins involved in signal transduction and is responsible for protein–protein interaction. SAP motif (Pfam PF02037, yellow) represents a putative DNA binding domain found in a diverse number of proteins involved in chromosomal organization (40). The MTS present in TEFM is indicated in orange. See Supplementary Data for further details. (B) Sub-cellular location of TEFM. The HOS cells were fractionated into fraction containing unbroken cells and cell debris (‘D’, lane 2), cytosol (‘C’, lane 3) and mitochondria (‘M’, lane 4) as described ‘Materials and Methods’ section. The protein fractions were analysed by western blotting using antibodies to endogenous TEFM. The location of TEFM was compared with that of the following marker proteins: TFAM (mitochondrial matrix), TOM22 (mitochondrial outer membrane), GAPDH (cytosol). (C) The intra-cellular localization of the HA-tagged variant of TEFM (green) by immunofluorescence, in human A549 cells, as described in ‘Materials and Methods’ section. Mitochondria were stained with MitoTracker Red CMXRos (red); the nucleus was stained with DAPI (blue). Yellow signal on digitally overlaid pictures indicated that TEFM has the same cellular distribution as mitochondria.
Figure 2.
Figure 2.
Defects in respiratory chain function upon TEFM gene silencing. (A) Western blot analyses of steady-state protein level of TEFM and subunits of respiratory chain complexes in control cells (untransfected cells and siRNA GFP) and cells treated with siRNA TEFM for 3 and 6 days. (B) Oxygen consumption rate (OCR) measured in quadruplicate population of control cells transfected siRNA GFP (green), cells treated with siRNA TEFM for 3 days (siRNA 1 in dark blue and siRNA 2 in light blue) and cells lacking mtDNA (Rho0, yellow). (C) Respiratory control ratio (RCR) in cells treated with siRNA GFP or siRNA TEFM for 3 or 6 days.
Figure 3.
Figure 3.
Steady-state levels of mtDNA and mitochondrial transcripts in cells with inactivated TEFM. (A) mtDNA copy number as measured by comparative qPCR of the mitochondrial Cox2 gene and single copy nuclear gene (APP) in controls (Untransfected and siRNA GFP) and cells treated with TEFM siRNA (siRNA TEFM 1 and 2). *P < 0.05, n = 3, error bars indicate 1 SD. (B) Northern blot analyses of mitochondrial transcripts transcribed from the HSP1 or LSP promoter in control cells (untransfected and treated with GFP siRNA) and cells treated with TEFM siRNA for 3 or 6 days. Nuclear 28S rRNA was used as a loading control. (C and D) Quantification of steady-state levels of the H-strand mitochondrial transcripts in cells treated with TEFM siRNA for 3 days (C) and 6 days (D) analysed by northern blots. The values of the relative RNA level (mtRNA/28S rRNA) were obtained by quantifying PhosphoImager scans of blots in the ImageQuant software and normalized for the values obtained for control cells transfected with siRNA GFP. The relative RNA level of each transcript for siRNA TEFM 1 (square) and 2 (triangle) was plotted in the function of the distance of its 3′ end from HSP. Dotted line, trend for siRNA GFP control; solid line, trend for siRNA TEFM 1; dashed line, trend for siRNA TEFM 2. Red symbols indicate the RNA19 transcript. n = 3, error bars = 1 SD. The P-values (two-tailed Student’s t-test) for each transcript calculated for combined values for both TEFM siRNAs for 3 days: 12S = 0.103, 16S = 0.719, RNA19 = 0.124, ND1 = 0.492, ND2 = 0.234, COI = 0.009, COII = 0.031, ATP6/8 = 0.064, COIII = 0.023, ND3 = 0.890, ND4/4L = 0.006, ND5 = 0.007, CytB < 0.001, ND6 = 0.502; and for 6 days: 12S = 0.813, 16S = 0.092, RNA19 = 0.187, ND1 = 0.026, ND2 = 0.285, COI = 0.003, COII = 0.129, ATP6/8 = 0.025, COIII = 0.027, ND3 = 0.169, ND4/4L < 0.001, ND5 = 0.002, CytB < 0.001, ND6 = 0.137. The quantification of the steady-state level of the ND6 transcript that is transcribed from LSP is shown in Supplementary Figure S2.
Figure 4.
Figure 4.
Steady-state levels of mitochondrial tRNAs in TEFM-depleted cells. (A)(B) Northern blot analyses of mitochondrial tRNAs transcribed from the HSP (A) or LSP (B) promoter in control cells (untransfected and treated with GFP siRNA) and cells treated with TEFM siRNA for 3 or 6 days. Nuclear 18S rRNA was used as a loading control. (C)–(F) Quantification of steady-state levels of the H-strand (C and D) or L-strand (E and F) mitochondrial tRNAs in cells treated with TEFM siRNA for 3 days (C and E) and 6 days (D and F) analysed by Northern blots. The values of the relative RNA level (tRNA/28S rRNA) were obtained by quantifying PhosphoImager scans of blots in the ImageQuant software and normalized for the values obtained for control cells transfected with siRNA GFP. The relative RNA level of each tRNA for siRNA TEFM 1 (square) and 2 (triangle) was plotted in the function of the distance of its 3′-end from the promoters. Dotted line, trend for siRNA GFP control; solid line, trend for siRNA TEFM 1; dashed line, trend for siRNA TEFM 2. n = 3, error bars = 1 SD. The P-values (two-tailed Student’s t-test) for each tRNA calculated for combined values for both TEFM siRNAs for 3 days: F = 0.553, L(UUA/G) = 0.303, K = 0.002, S(AGY) = 0.001, T = 0.002, P = 0.103, S(UCN) = 0.004, Q < 0.001; and for 6 days: F = 0.656, L(UUA/G) = 0.154, K < 0.001, S(AGY) < 0.001, T = 0.002, P = 0.297, S(UCN) = 0.002, Q = 0.004.
Figure 5.
Figure 5.
Mitochondrial RNA polymerase co-purifies with TEFM. (A) A SDS–PAGE gel stained with Coomassie Brilliant Blue showing the protein profile of the affinity purification of the TEFM.STREP2 from the mitochondria of HEK cells. The most intense protein band of ∼40 kDa seen in the elution fractions 2–4 corresponds to the purified TEFM.STREP2 protein. M, total mitochondrial lysate; FT, flow-through; MW, Molecular weight marker. (B) A SDS–PAGE gel stained with Coomassie Brilliant Blue with concentrated fractions from 2 to 5 (E2–5). Protein bands were cut from the gel and analysed by mass spectrometry. The identities of the protein are shown on the left-hand side. Some endogenous mitochondrial biotinylated proteins (e.g. 3-hydroxyacyl-CoA dehydrogenase α-subunit or hydroxyacyl dehydrogenase, subunit B) were detected in the analysis as affinity purification system used here is based on the interaction between the STREP2 tag and engineered streptavidin (Strep-Tactin), which also binds biotin. Only biotinylated proteins were detected in mock affinity capture experiments performed on parental HEK cells (data not shown). The presence of the mitochondrial chaperone protein, MTHSP75, in our preparation could well result from a mitochondrial stress response caused by overexpression of TEFM (41). (C)(E) Western blots confirming the identity of the proteins that co-purify with TEFM that were detected by mass spectrometry (C) or documenting that there was no enrichment of highly abundant mitochondrial proteins (D) or mitochondrial proteins involved in the initiation of mtDNA transcription (E). (F) A SDS–PAGE gel stained with Coomassie Brilliant Blue showing the protein profile of the affinity purification of the POLRMT.STREP2 from the mitochondria of HEK cells. The most intense protein band of ∼140 kDa seen in the elution fractions 3–4 corresponds to the purified POLRMT.STREP2 protein. M, total mitochondrial lysate; FT, flow-through; MW, Molecular weight marker. (G) Western blots illustrating the protein profile of the affinity purification of the POLRMT.STREP2 from the mitochondria of HEK cells. (H) Relative abundance of proteins that co-purify with POLRMT.STREP2. The values were obtained by quantifying PhosphoImager scans of western blots from (G) in the ImageQuant software and normalized for the values obtained for the total mitochondrial lysate.
Figure 6.
Figure 6.
Functional interaction of TEFM with RNA. (A) SDS–PAGE analysis of the affinity purified TEFM complex (lanes 1–3) treated with DNase I (lanes 4–6) lanes or RNase A (lanes 7–9) prior to the loading on the Strep-Tactin column. M, mitochondrial lysate; FT, flow through; E2, elution fraction 2; single asterisk, DNase I; two asterisks, RNase A. (B) Western blotting analysis of the SDS–PAGE gel shown in (C). The blot was incubated with the antibodies indicated to the right of the panel. (C) The co-localization of the HA-tagged version of TEFM with mtDNA and mtRNA analysed by immunofluorescence in A549 cells as described in ‘Materials and Methods’ section. Incorporation of BrU in RNA was visualized in cultured cells with BrU-specific mAbs. Black and white images shown in the top row were pseudo-coloured in red or green as indicated in the top right corner of each image and digitally overlaid; yellow staining is indicative of co-localization.
Figure 7.
Figure 7.
TEFM interacts with C-terminal, catalytic part of POLRMT. (A) Schematic representation of the myc-tagged POLRMT constructs used to map the interaction with TEFM in comparison with the T7 phage RNA polymerase (T7RNAP). The N-terminal extension present in the POLRMT (dark gray) is missing in the T7RNAP. f.l., full-length. (B) Western blot of the control pull-down experiment with mock (left) and the full-length POLRMT (right) transfected HEK cells that inducibly express TEFM.STREP2. The blot was incubated with the antibodies indicated to the right. T, total cell lysate; P, pulled-down material. The asterisk indicates a non-specific band. (C) Western blot of the pull-down experiment with the POLRMT lacking the N-terminal extension (POLRMT MTS-768-1230, left) or the C-terminal catalytic part (POLRMT 1-801, right) with TEFM.STREP2. The asterisk indicates a non-specific band.
Figure 8.
Figure 8.
Stimulation of the POLRMT activity by TEFM. (A) Coomassie Brilliant Blue stained SDS–PAGE gel showing E. coli purified the GST.TEFM protein fusion. MW, molecular weight marker. (B) The synthesis of 32P-labelled RNA by POLRMT (0.35 pmol) on M13mp18(+) ssDNA in the absence (lane2) and the presence of 1.0 pmol (lane 4), 0.33 pmol (lane 5) and 0.11 pmol (lane 6) of GST.TEFM was performed as described in ‘Materials and Methods’ section. The products were separated on a 5% UREA polyacrylamide gel and subjected to autoradiography. (C) Relative abundance of the RNA products of indicated lengths synthesized by POLRMT on the ssDNA template in the presence of different concentrations of GST.TEFM. The values were obtained by quantifying PhosphoImager scans of dried UREA gels in the ImageQuant software and normalized for the values obtained from the reaction with POLRMT only. *P < 0.05, **P < 0.01, ***P < 0.001; two-tailed Student’s t-test; n = 4, Error bars = 1 SD. (D) Schematic representation of the construction of long 3′-tailed dsDNA templates. (E) The synthesis of 32P-labelled RNA by POLRMT (0.35 pmol) on 3′-tailed dsDNA of different length (20, 100 and 400 bp) in the absence (lanes 1, 5 and 9) and the presence of 1.0 pmol (lanes 2, 6 and 10), 0.33 pmol (lanes 3, 7 and 11) and 0.11 pmol (lanes 4, 8 and 12) of GST.TEFM for the indicated time. (F) The ratio between the 400 and 20 nt RNA products synthesized by POLRMT on the 3′-tailed dsDNA template in the presence of different concentrations of TEFM. The values were normalized with respect to the reaction with POLRMT alone. *P < 0.05; two-tailed Student’s t- test; n = 3, Error bars = 1 SD.

References

    1. Forner F, Foster LJ, Campanaro S, Valle G, Mann M. Quantitative proteomic comparison of rat mitochondria from muscle, heart, and liver. Mol. Cell Proteomics. 2006;5:608–619. - PubMed
    1. Pagliarini DJ, Calvo SE, Chang B, Sheth SA, Vafai SB, Ong SE, Walford GA, Sugiana C, Boneh A, Chen WK, et al. A mitochondrial protein compendium elucidates complex I disease biology. Cell. 2008;134:112–123. - PMC - PubMed
    1. Taylor SW, Fahy E, Zhang B, Glenn GM, Warnock DE, Wiley S, Murphy AN, Gaucher SP, Capaldi RA, Gibson BW, et al. Characterization of the human heart mitochondrial proteome. Nat. Biotechnol. 2003;21:281–286. - PubMed
    1. Calvo S, Jain M, Xie X, Sheth SA, Chang B, Goldberger OA, Spinazzola A, Zeviani M, Carr SA, Mootha VK. Systematic identification of human mitochondrial disease genes through integrative genomics. Nat. Genet. 2006;38:576–582. - PubMed
    1. Lopez MF, Kristal BS, Chernokalskaya E, Lazarev A, Shestopalov AI, Bogdanova A, Robinson M. High-throughput profiling of the mitochondrial proteome using affinity fractionation and automation. Electrophoresis. 2000;21:3427–3440. - PubMed

Publication types

MeSH terms