. 2011 Mar;12(3):255-63.
doi: 10.1038/ni.1993. Epub 2011 Jan 30.

Fate mapping of IL-17-producing T cells in inflammatory responses

Affiliations

Fate mapping of IL-17-producing T cells in inflammatory responses

Keiji Hirota et al. Nat Immunol. 2011 Mar.

Abstract

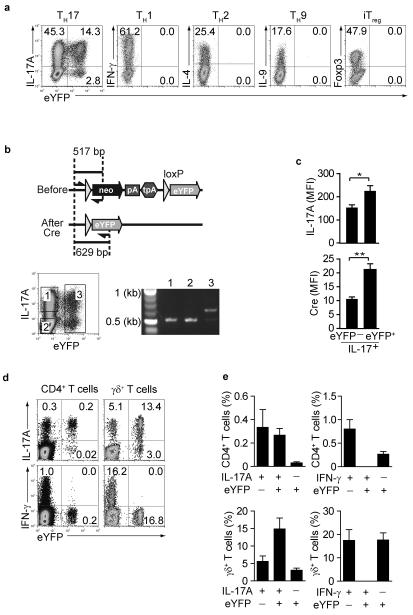
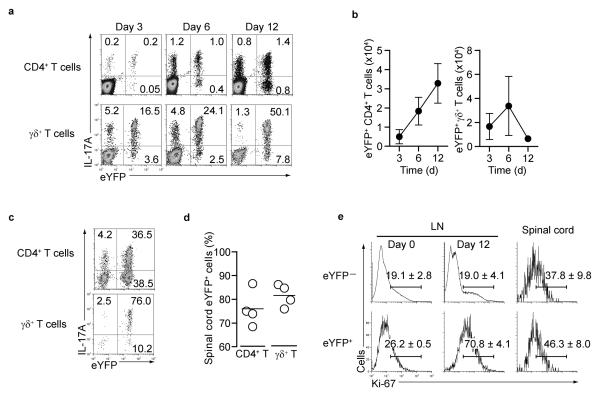
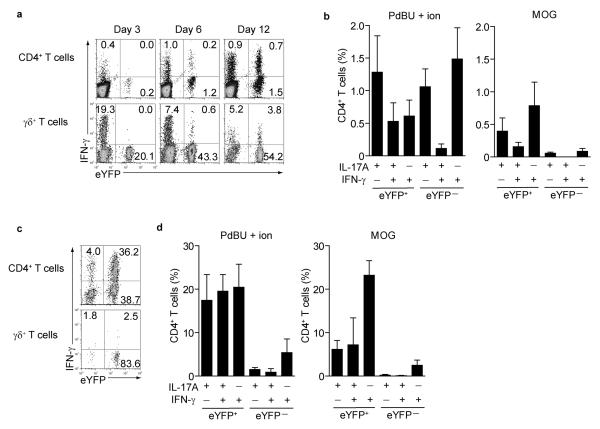
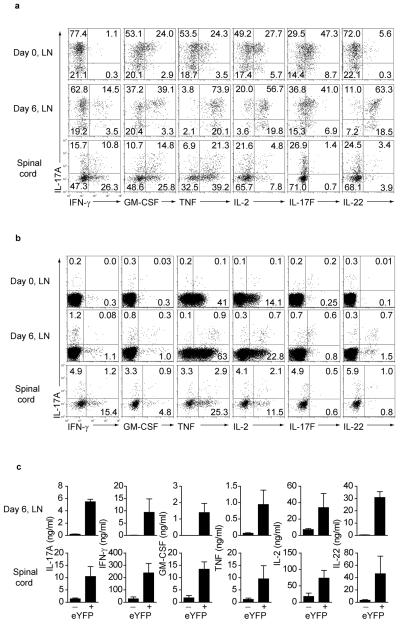
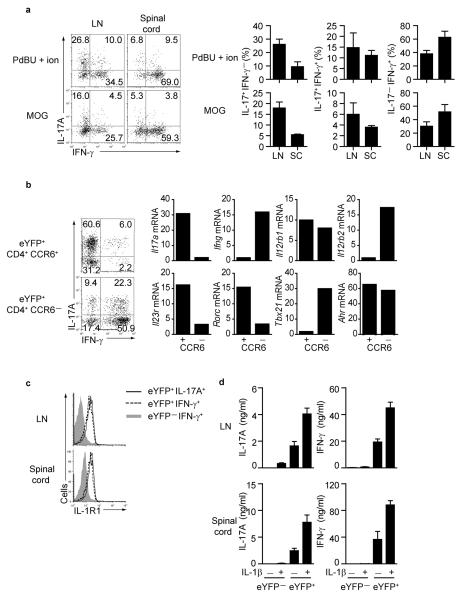
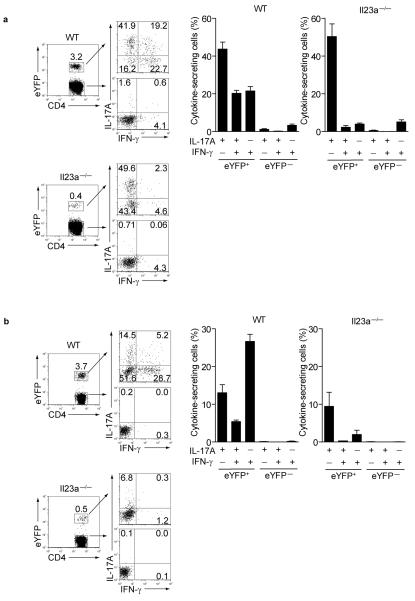
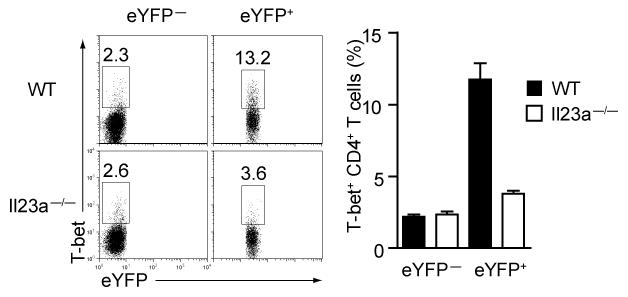
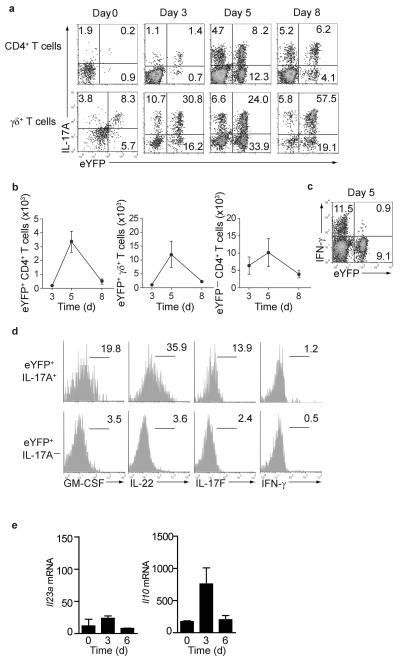
Here we describe a reporter mouse strain designed to map the fate of cells that have activated interleukin 17A (IL-17A). We found that IL-17-producing helper T cells (T(H)17 cells) had distinct plasticity in different inflammatory settings. Chronic inflammatory conditions in experimental autoimmune encephalomyelitis (EAE) caused a switch to alternative cytokines in T(H)17 cells, whereas acute cutaneous infection with Candida albicans did not result in the deviation of T(H)17 cells to the production of alternative cytokines, although IL-17A production was shut off in the course of the infection. During the development of EAE, interferon-γ (IFN-γ) and other proinflammatory cytokines in the spinal cord were produced almost exclusively by cells that had produced IL-17 before their conversion by IL-23 ('ex-T(H)17 cells'). Thus, this model allows the actual functional fate of effector T cells to be related to T(H)17 developmental origin regardless of IL-17 expression.


Figures

Figure 1
Figure 1. Induction of fate reporter eYFP+ cells in IL-17-producing cells
(a) Naïve CD4+CD44loCD25 T cells were cultured under TH1, TH2, TH9, TH17 or iTreg conditions for 4 days and stained for indicated intracellular cytokines. Dot plots show intracellular cytokine expression vs eYFP (b) Schematic representation of PCR primer location used for assessment of Cre-mediated recombination at the ROSA26 eYFP locus. Cells cultured under TH17 conditions in vitro were sorted according to the gates indicated and DNA from sorted populations were tested for recombination at the ROSA26 eYFP locus. (c) mean fluorescence intensity for IL-17A(top) and Cre (bottom) in IL-17A+eYFP and IL-17A+eYFP+ populations. Mean values and SD are shown. *denotes P value 0.03, ** denotes P value 0.01 (d) LN cells from non-immune mice were stained for CD4 and γδ TCR, followed by intracellular IL-17A and IFN-γ staining. Dot plots show intracellular staining vs eYFP expression. The FACS plots are representative for three independent experiments and bar graphs showing experimental variability are shown in (e).
Figure 2
Figure 2. Kinetics of eYFP and IL-17A expression during EAE induction
(a) Draining LN cells from MOG/CFA immunized mice were stained for CD4 and γδ TCR and assessed for eYFP and intracellular IL-17A at the indicated days after immunization. (b) Absolute numbers of eYFP+ CD4 and γδ T cells in the draining LN. Data show mean + SD from three mice. (c) Expression of eYFP and IL-17A of infiltrating CD4+ and γδ T cells in the spinal cord. (d) The percentage of eYFP positive CD4+ T cells or γδ T cells in the spinal cord (day 16 after EAE induction) is shown. The bars indicate mean derived from four immunized mice. Data in (a) and (c) represent three independent experiments. (e) FACS analysis for expression of the proliferation marker Ki-67 performed on gated CD4 eYFP or eYFP+ cells from lymph node (day 0 and day 12) and spinal cord (day15) with experimental variation in three independent experiments indicated by % values shown in the plots.
Figure 3
Figure 3. IFN-γ expression and antigen specificity in eYFP+ and eYFP CD4 T cells
(a) Draining LN cells from MOG/CFA immunized mice were stained for CD4 and γδ TCR and assessed for eYFP and intracellular IFNγ at the indicated days after immunization. (b) bar graphs showing % of eYFP+ or eYFP CD4 T cells from draining lymph nodes at day 12 expressing cytokines following restimulation with PdBU-ionomycin (left panel) or MOG peptide (right panel). Mean values +/− SD of three individual mice are shown. (c) Representative FACS plots showing expression of eYFP and IFN-γ of infiltrating CD4+ and γδ T cells in the spinal cord. (d) bar graphs showing % of eYFP+ or eYFP CD4 T cells from spinal cord at day 15 expressing cytokines following restimulation with PdBU-ionomycin (left panel) or MOG peptide (right panel).
Figure 4
Figure 4. Cytokine expression in eYFP+ and eYFP CD4+ T cells in the draining LN and spinal cord
(a) Lymph nodes from non-immune mice (day 0) as well as draining LN and spinal cord cells 6 and 15 days after EAE induction, respectively, were stained for CD4 and intracellular cytokines as indicated. The dot plots show cytokine expression profiles in gated eYFP+ CD4+ T cells (a) and gated eYFP CD4+ T cells in (b). The data are representative for at least three independent experiments. (c) Cytokine concentrations measured in supernatant of 2×10⁴ sorted eYFP+ or eYFP CD4 T cells isolated from day 6 lymph nodes or day 15 spinal cord and restimulated in vitro with anti-CD3/anti-CD28 for 24h. Data show mean values +/− SD of cytokines measured from three individual mice.
Figure 5
Figure 5. Transcriptional changes in eYFP+ CD4+ T cells
(a) CCR6+ eYFP+ CD4+ T cells from 2D2 IL-17-reporter mice were purified 4 days after MOG-CFA immunization and adoptively transferred into immunized Rag-deficient mice. FACS plots and bar graphs of IL-17A and IFN-γ expression in eYFP+ CD4+ T cells from draining lymph nodes and spinal cord (day 16) restimulated with PdBU-ionomycin (upper panels) or MOG peptide (lower panels). Histograms show mean values for individual mice +/− SD. (b) CCR6 and CCR6+ eYFP+ CD4+ T cells from spinal cord were sorted for qPCR analysis. Representative FACS plots show expression of IL-17A and IFN-γ. Relative gene expression in sorted (not restimulated) cells normalized to the expression of Hprt is shown. (c) CD4+eYFPIFN-γ+, representing TH1, (shaded gray), CD4+eYFP+IFN-γ+ (ex-TH17 -dotted line), and CD4+eYFP+IL-17A+ (TH17- solid line) from draining LN and spinal cord cells 15 days after MOG-CFA immunisation were gated and assessed for IL-1R1 expression. The data represent at least three independent experiments. (d) Cytokine levels measured in supernatant of purified eYFP+ or eYFP CD4 T cells from draining lymph nodes or spinal cord (day 15) restimulated with anti-CD3 +/− 20 ng/ml IL-1β for 24 hr. Data show mean values ± SD of cytokines from three individual mice. The data represent at least three independent experiments.
Figure 6
Figure 6. IL-23 signalling is required for acquisition of eYFP+ IFN-γ+ profile
(a) Representative FACS plots (left) and bar graphs showing expression of IL-17A and IFNγ in eYFP+ and eYFP CD4 T cells from day 12 draining lymph nodes of wild-type or IL-23 p19−/− reporter mice following restimulation with either PdBU/ionomycin or (b) MOG peptide. Data show mean values +/− SD of three individual mice.
Figure 7
Figure 7. T-bet expression is curtailed in the absence of IL-23
Representative FACS plots and bar graphs showing expression of eYFP and T-bet in eYFP+ and eYFP CD4 T cells from day 6 draining lymph nodes of wildtype or IL-23p19 deficient reporter mice. The bar graphs show means ± SD of three individual mice.
Figure 8
Figure 8. Cutaneous infection with Candida albicans
Skin (1cm2) of IL-17A fate reporter mice infected with Candida albicans hyphae was analyzed at the timepoints depicted. (a) intracellular IL-17A and eYFP expression in CD4+ and γδ T cells is shown. (b) absolute numbers of eYFP positive CD4+ and γδ T cells and eYFP cells in the skin at the indicated time points. Mean + SD values from 3-5 mice per time point are shown. (c) intracellular IFN-γ and eYFP expression in CD4+ T cells. Data are representative of two independent experiments (d) histograms showing cytokine expression in gated eYFP+ IL-17+ and eYFP+ IL-17 CD4 T cells on day 5 after infection. The data are representative of two independent experiments. (e) CD11b+ and CD11c+ cells were MACS sorted from the infected skin for qPCR analysis. Relative gene expression in sorted cells normalized to the expression of Hprt is shown. The bar graphs show means ± SD of three individual mice. Data are representative of two independent experiments.

Comment in

  • T cells: Plastic TH17 cells.
    Leavy O. Leavy O. Nat Rev Immunol. 2011 Mar;11(3):160. doi: 10.1038/nri2942. Nat Rev Immunol. 2011. PMID: 21456313 No abstract available.

References

    1. Harrington LE, et al. Interleukin 17-producing CD4+ effector T cells develop via a lineage distinct from the T helper type 1 and 2 lineages. Nat Immunol. 2005;6(11):1123–1132. - PubMed
    1. Park H, et al. A distinct lineage of CD4 T cells regulates tissue inflammation by producing interleukin 17. Nat Immunol. 2005;6(11):1133–1141. - PMC - PubMed
    1. Veldhoen M, et al. TGFbeta in the context of an inflammatory cytokine milieu supports de novo differentiation of IL-17-producing T cells. Immunity. 2006;24(2):179–189. - PubMed
    1. Ivanov II, et al. The orphan nuclear receptor RORgammat directs the differentiation program of proinflammatory IL-17+ T helper cells. Cell. 2006;126(6):1121–1133. - PubMed
    1. Yang XO, et al. T helper 17 lineage differentiation is programmed by orphan nuclear receptors ROR alpha and ROR gamma. Immunity. 2008;28(1):29–39. - PMC - PubMed

Publication types