. 2011 Mar;12(3):247-54.
doi: 10.1038/ni.1995. Epub 2011 Jan 30.

Opposing regulation of the locus encoding IL-17 through direct, reciprocal actions of STAT3 and STAT5

Affiliations

Opposing regulation of the locus encoding IL-17 through direct, reciprocal actions of STAT3 and STAT5

Xiang-Ping Yang et al. Nat Immunol. 2011 Mar.

Abstract

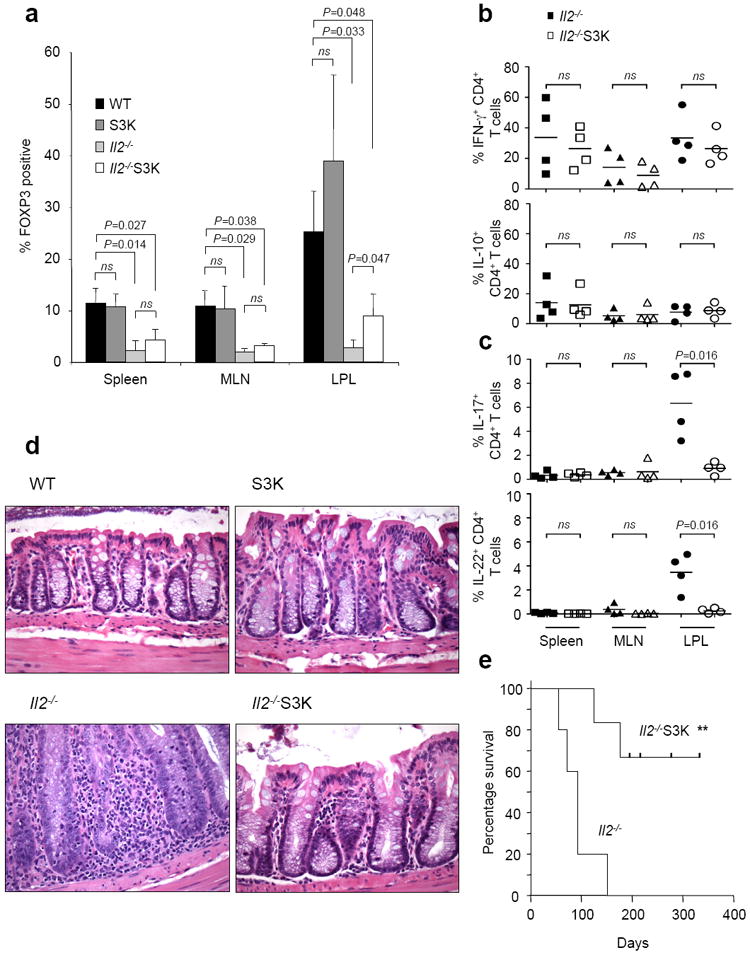
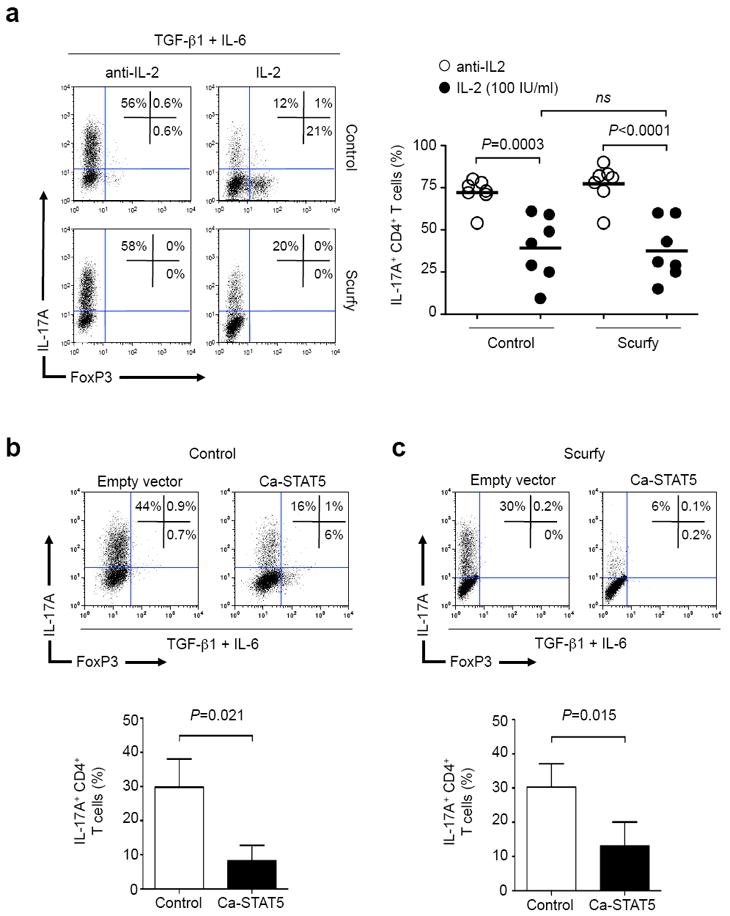
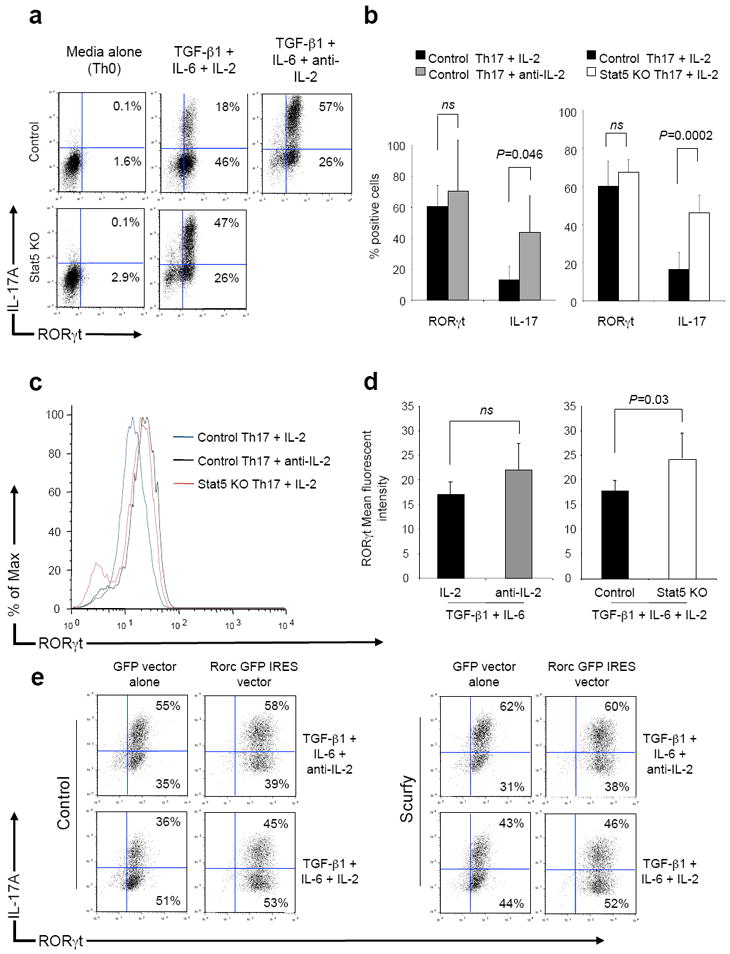
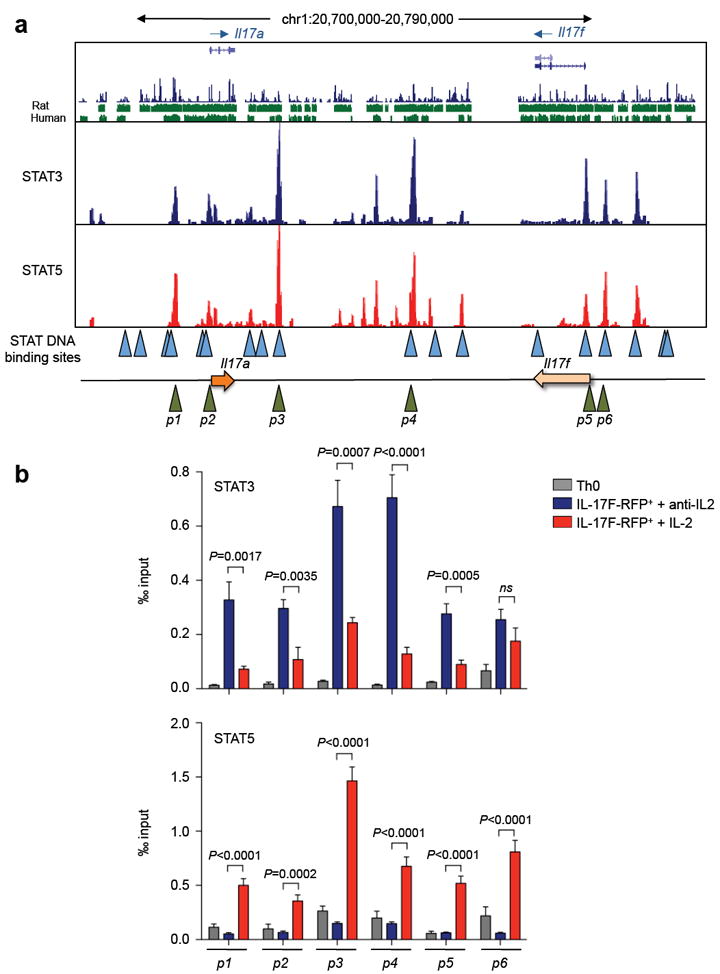
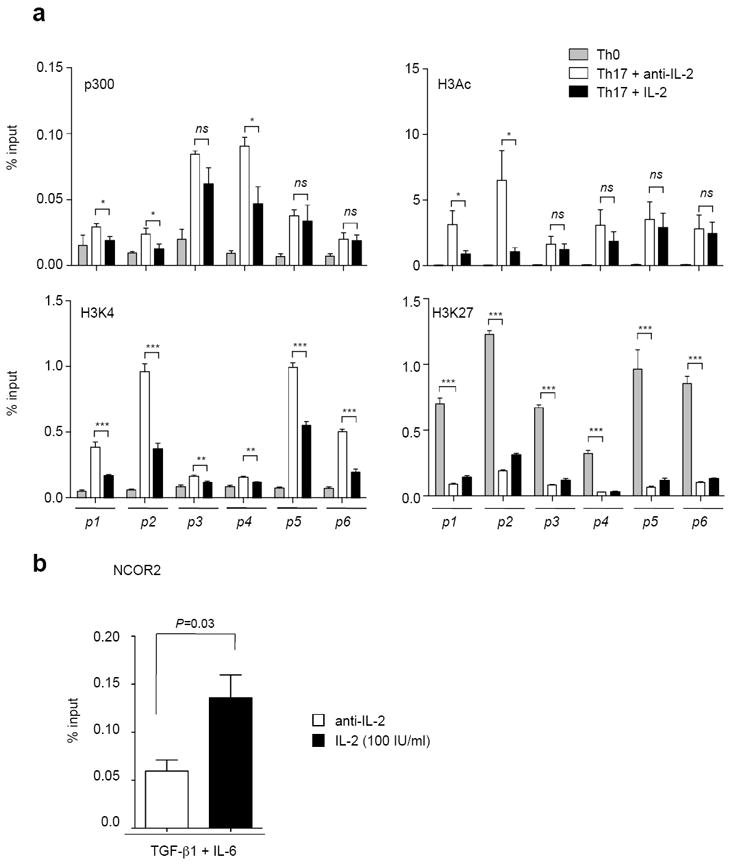
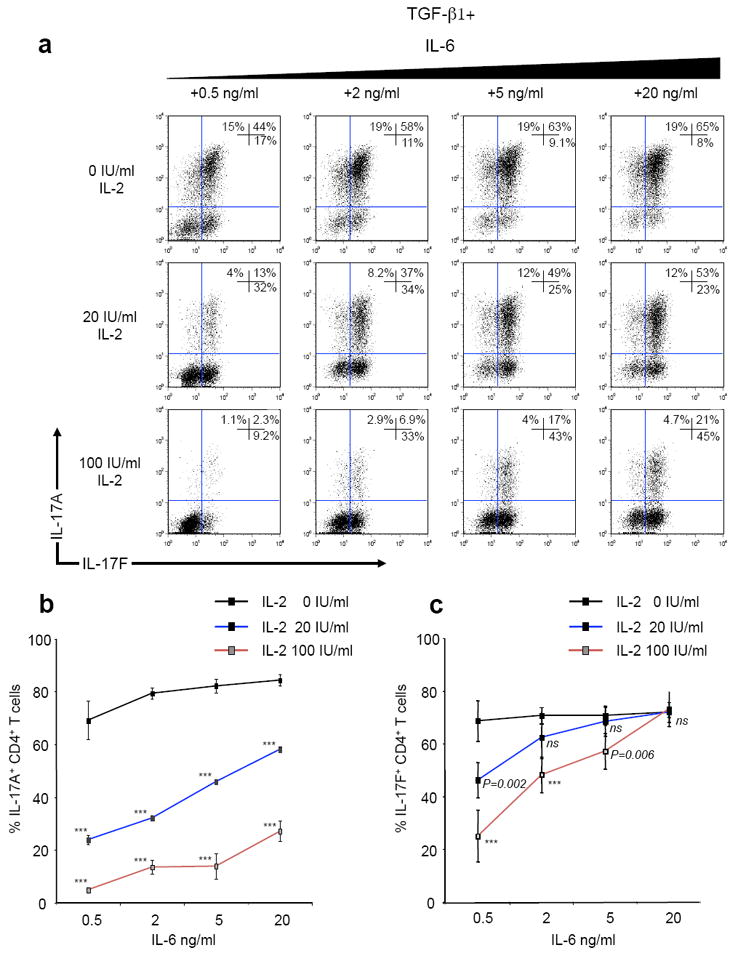
Interleukin 2 (IL-2), a cytokine linked to human autoimmune disease, limits IL-17 production. Here we found that deletion of the gene encoding the transcription factor STAT3 in T cells abrogated IL-17 production and attenuated autoimmunity associated with IL-2 deficiency. Whereas STAT3 induced IL-17 and the transcription factor RORγt and inhibited the transcription factor Foxp3, IL-2 inhibited IL-17 independently of Foxp3 and RORγt. STAT3 and STAT5 bound to multiple common sites across the locus encoding IL-17. The induction of STAT5 binding by IL-2 was associated with less binding of STAT3 at these sites and the inhibition of associated active epigenetic marks. 'Titration' of the relative activation of STAT3 and STAT5 modulated the specification of cells to the IL-17-producing helper T cell (T(H)17 cell) subset. Thus, the balance rather than the absolute magnitude of these signals determined the propensity of cells to make a key inflammatory cytokine.


Conflict of interest statement

Competing interests statement The authors declare that they have no competing financial interests.

Figures

Figure 1
Figure 1. The inflammatory colitis in IL-2 deficient mice is dependent on T cell STAT3
(a) CD4+ T cells were isolated from the spleen, mesenteric lymph nodes (MLN) and colonic lamina propria (LPL) of three month old Stat3fl/fl (WT), CD4-Cre;Stat3fl/fl (S3K), Il2-/- or CD4-Cre;Stat3fl/fl;Il2-/- (Il2-/-S3K) mice. FOXP3 expression was determined by intracellular staining. Histograms representing data from four separate experiments are shown. Paired t tests were used to determine statistical significance (ns: not significant). (b, c) Cells were stimulated for two hours with PMA, ionomycin and brefeldin A and expression of IFN-γ, IL-10 (b) and IL-17, IL-22 (c) was determined by intracellular staining. Data are representative of four separate experiments; Statistics were determined by paired t testing (ns: not significant). (d) Formaldehyde fixed colon sections of WT, S3K, Il2-/- and Il2-/-S3K mice were stained with haematoxylin and eosin. (e) Kaplan-Meyer survival curve comparing mice with IL-2 deficiency (Il2-/-) and mice with both STAT3 and IL-2 deficiency (Il2-/-S3K) (**P=0.003).
Figure 2
Figure 2. IL-2 inhibits IL-17A expression in the absence of FOXP3
(a) Naïve CD4+ T cells from control (Rag1-/-;OT2) and Scurfy (Foxp3sf;Rag1-/-;OT2) mice were stimulated with TGF-β1, IL-6, anti-IFN-γ, anti-IL-4 and anti-IL-2 (left panels) or hIL-2 (right panels). IL-17A and FOXP3 expression were determined by intracellular staining. Representative flow cytometry is shown (left panel a) together with cumulative results of seven biological replicates from four independent experiments (right panel a), and significance was determined by unpaired t testing (ns: not significant). (b, c) Naïve CD4+ T cells from control (Rag1-/-;OT2) mice (b) and Scurfy (Foxp3sf;Rag1-/-;OT2) mice (c) were activated in media alone. Twenty-four and 48 hours later, cells were infected with retrovirus expressing human NGF-receptor (hNGFR) (empty vector) or hNGFR together with a constitutively active STAT5 (Ca-STAT5). After the second virus transduction, TGF-β1, IL-6, anti-IFN-γ, anti-IL-4 and anti-IL-2 were added to the culture. Two days later, IL-17A and FOXP3 expression were determined by intracellular staining. Flow cytometry plots of a single representative experiment are shown above; the histogram representing three independent experiments is below. Significance was determined using a paired t test.
Figure 3
Figure 3. Over-expression of RORγt does not abrogate the inhibitory effect of IL-2
(a,b) Naïve CD4+ T cells from control (Stat5fl/fl;OT2) mice were stimulated in media (Th0), the presence of TGF-β1, IL-6 and IL-2 or the presence of TGF-β1, IL-6 and anti-IL-2. Naïve T cells from STAT5 KO (CD4-Cre;Stat5fl/fl;OT2) mice were stimulated in media (Th0) or the presence of TGF-β1, IL-6 and IL-2. After three days, RORγt and IL-17 expression was determined by intracellular staining. Data from a single representative experiment (a) and three independent experiments (b) are shown. Significance was determined using a paired t test (ns: not significant). (c,d) Mean fluorescence intensity for RORγt was determined for CD4+ T cells from control mice stimulated under Th17 conditions in the presence of anti-IL-2 or IL-2 or from STAT5 KO mice stimulated under Th17 conditions in the presence of IL-2, a single representative experiment is shown (c) together with cumulative data from three independent experiments (d). P values were determined by paired t testing (ns: not significant). (e) Naïve CD4+ T cells from control (Rag1-/-;OT2) or Scurfy (Foxp3sf;Rag1-/-;OT2) mice were stimulated in the presence of TGF-β1, IL-6 and anti-mIL-2 for two days. On day 1 and day 2, cells were infected with retrovirus containing GFP alone or GFP together with RORγt. After two days, IL-2 was added (lower panels) and the cells were incubated for a further two days. RORγt and IL-17 expression was determined in the GFP positive cell population by intracellular staining in cells stimulated again for 2 hours with PMA, ionomycin and brefeldin A.
Figure 4
Figure 4. STAT3 and STAT5 compete for the same binding sites within the Il17a-f locus
(a) Naïve CD4+ T cells were stimulated for three days under Th17 conditions. On the third day cells were either stimulated with IL-6, crosslinked with formaldehyde and immunoprecipitated with anti-STAT3 (upper panel a) or stimulated with IL-2 and immunoprecipitated with anti-STAT5 (lower panel a). Immunoprecipitated DNA was sequenced by massive parallel sequencing. The Il17a-f locus is illustrated; the locations of primer sites p1 – p6 are depicted by green triangles and candidate STAT binding sites are illustrated by blue triangles. (b) Naïve CD4+ T cells from IL-17F-RFP reporter mice were cultured for three days in media alone (Th0), or with TGF-β1, IL-6 and anti-IL-2 (Th17+anti-IL-2) or with TGF-β1, IL-6 and IL-2 (Th17+IL-2). On the third day, RFP+ cells from both groups were isolated using flow cytometry cell sorting. Cells were restimulated with IL-6 in the presence or absence of IL-2, crosslinked with formaldehyde, and immunoprecipitated with anti-STAT3 (b, upper panel) and anti-STAT5 (b, lower panel). Bound DNA was amplified by quantative-PCR for primer sites p1 – p6 and expressed as a permil of input DNA. Data are pooled from two independent experiments. Error bars denote s.e.m and P values were determined by unpaired t testing (ns: not significant).
Figure 5
Figure 5. STAT5 binding is associated with a reduction in active epigenetic marks across the Il17a promoter region and associated enhancer elements
Naïve CD4+ T cells were stimulated for three days in the presence of media with anti-IFN-γ, anti-IL-4 alone (Th0), anti-IFN-γ, anti-IL-4, TGF-β1, IL-6 and anti-IL-2 (Th17+anti-IL-2) or anti-IFN-γ, anti-IL-4, TGF-β1, IL-6 and IL-2 (Th17+IL-2). Cells were crosslinked and immunoprecipitated with anti-p300, anti-H3Ac, anti-H3K4me3, anti-H3K27me3. DNA was amplified as described in Fig. 5 and expressed as a percentage of input DNA. The data are representative of two independent experiments. (b) Naïve CD4+ T cells were stimulated under Th17 condition with anti-IL-2 or IL-2. Cells were crosslinked and immunoprecipitated with anti-NCoR2. Immunoprecipitated DNA was determined for the p4 region by quantitative-PCR and expressed as a percentage of input DNA. Data are representative of three independent experiments. Error bars denote s.e.m and P values were determined by unpaired t testing (* P<0.05, ** P<0.01, *** P<0.001, ns: not significant)
Figure 6
Figure 6. Th17 generation is dynamically regulated by opposing effects of IL-2 and IL-6: differential regulation of IL-17A and IL-17F
(a-c) Naïve CD4+ T cells were polyclonally stimulated for three days with anti-IFN-γ, anti-IL-4, anti-mIL-2, TGF-β1, varying concentrations of hIL-2 (0 to 100 IU/ml) and IL-6 (0.5 to 20 ng/ml). IL-17A and IL-17F expression was determined by intracellular staining. (a) Flow cytometry plots showing a single representative experiment. (b,c) Summary of four biological replicates from two separate experiments showing the effect of altered IL-2 and IL-6 doses on (b) IL-17A expression and (c) IL-17F expression. Statistics were determined using an unpaired t test (*** P<0.001, ns: not significant).

References

    1. Weaver CT, Hatton RD. Interplay between the TH17 and TReg cell lineages: a (co-)evolutionary perspective. Nat Rev Immunol. 2009;9:883–889. - PubMed
    1. Zhu J, Yamane H, Paul WE. Differentiation of effector CD4 T cell populations (*) Annu Rev Immunol. 2010;28:445–489. - PMC - PubMed
    1. Buonocore S, et al. Innate lymphoid cells drive interleukin-23-dependent innate intestinal pathology. Nature. 2010;464:1371–1375. - PMC - PubMed
    1. Hsu HC, et al. Interleukin 17-producing T helper cells and interleukin 17 orchestrate autoreactive germinal center development in autoimmune BXD2 mice. Nat Immunol. 2008;9:166–175. - PubMed
    1. Veldhoen M, Hocking RJ, Atkins CJ, Locksley RM, Stockinger B. TGFbeta in the context of an inflammatory cytokine milieu supports de novo differentiation of IL-17-producing T cells. Immunity. 2006;24:179–189. - PubMed

Publication types