. 2011:711:397-419.
doi: 10.1007/978-1-61737-992-5_20.

Brain redox imaging

Affiliations

Brain redox imaging

Ken-ichiro Matsumoto et al. Methods Mol Biol. 2011.

Abstract

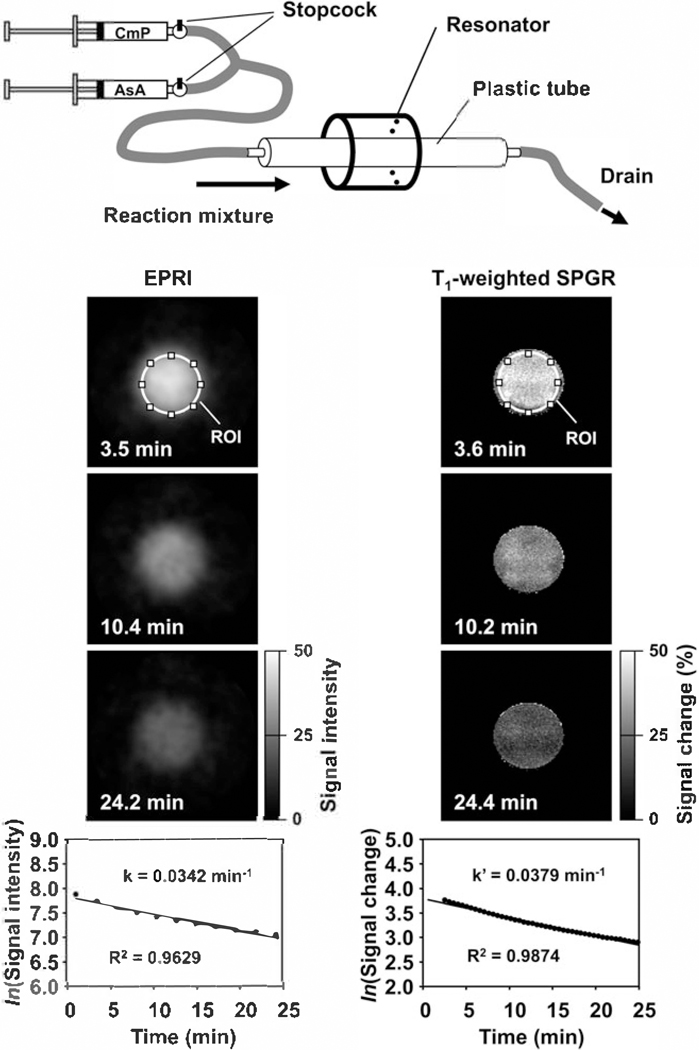
Nitroxyl contrast agents (nitroxyl radicals, also known as nitroxide) are paramagnetic species, which can react with reactive oxygen species (ROS) to lose paramagnetism to be diamagnetic species. The paramagnetic nitroxyl radical forms can be detected by using electron paramagnetic resonance imaging (EPRI), Overhauser MRI (OMRI), or MRI. The time course of in vivo image intensity induced by paramagnetic redox-sensitive contrast agent can give tissue redox information, which is the so-called redox imaging technique. The redox imaging technique employing a blood-brain barrier permeable nitroxyl contrast agent can be applied to analyze the pathophysiological functions in the brain. A brief theory of redox imaging techniques is described, and applications of redox imaging techniques to brain are introduced.


Figures

Fig. 20.1.
Fig. 20.1.
Structures and common names of commercialized nitroxyl radicals. a PROXYL derivatives and b TEMPO derivatives.
Fig. 20.2.
Fig. 20.2.
Reactive oxygen species (ROS), such as superoxide (·O2) and hydroxyl radical (·OH), undergo one electron reduction of nitroxyl radicals in the presence of hydrogen donors (H-donors), such as reduced nicotinamide adenine dinucleotide (NADH), and/or reduced nicotinamide adenine dinucleotide phosphate (NADPH). The nitroxyl radicals were once oxidized to an oxoammonium cation by ROS and then reduced to hydroxylamine by receiving a hydrogen atom from H-donors. Reduced glutathione (GSH) and oxoammonium cations may make another complex irreversibly. Therefore, the generation of total ROS can be estimated by a reduction of the nitroxyl radical under coexisting GSH.
Fig. 20.3.
Fig. 20.3.
A schematic drawing of the concept of dynamic imaging. The additional time dimension to the spatial mapping of the paramagnetic contrast agent, functional information, such as pharmacokinetics of the contrast agent, can be tagged on to the EPR image. The time axis is by sequential measurement of several EPR images. Consequently, pixel-wise decay rates of EPR image intensity can be obtained.
Fig. 20.4.
Fig. 20.4.
Autoradiograms of axial sections of rat head obtained after 3 min i.v. or 15 min after i.p. treatment with 14C-labeled MC-PROXYL or 14C-labeled carbamoyl-PROXYL. The black region shows high radioactivity and the white, no radioactivity, showing that MC-PROXYL, but not carbamoyl-PROXYL, can penetrate the BBB and is well distributed to brain tissue.
Fig. 20.5.
Fig. 20.5.
Time-resolved 2D EPR images in the head of a mouse. A 100 mL volume of CxP-AM (25 mM) in PBS with 10% (v/v) of ethanol was injected into the tail veins of mice and the data for images were collected at various time points. a Data collected 0.9–9.9 min after injection. b Data collected 10.4–19.3 min after injection, c Data collected 19.8–28.7 min after injection. d A semilogarithmic plot of the imaging intensity of two different regions (ROI 1 and ROI 2) in the brain after intravenous injection of CxP-AM.
Fig. 20.6.
Fig. 20.6.
Relationship between a paramagnetic nitroxyl contrast agent and an intensity change of T1-weighted SPGR-based MRI. a Simulated ΔM% increased with the concentration of paramagnetic nitroxyl contrast agent. b Low concentration region (<1.5 mM) in (a) (dotted rectangle area) was expanded. Fairly good linearity (R2 = 0.9995) was obtained between simulated ΔM% and the concentration of the low concentration region. Values used for the simulation were as follows: r1 = 0.13 mM−1 s−1, M0 = 1,000, TR = 75 ms, TE = 3 ms, FA = 45°, T1i = 2,350 ms, and T2* = 50 ms.
Fig. 20.7.
Fig. 20.7.
Comparison of EPR and MR redox imaging demonstrated using a phantom. Upper cartoon is a representation of the experimental device.
Fig. 20.8.
Fig. 20.8.
In vivo MR redox imaging. a Position of the slice scanned. b A time course of T1-weighted signal enhancement in the slice and a T2-mapping of the identical slice as a scout image. c A comparison of the time course of T1-weighted signal enhancement in the ROI-1 and ROI-2. d A redox map calculated based on the time course of nitroxyl-induced tissue T1-weighted signal enhancement.
Fig. 20.9.
Fig. 20.9.
Re-oxidation of a hydroxylamine to the corresponding nitroxyl radical by a chemical oxidant. Ferricyanide (FeK3(CN)6) has been usually used to oxidize hydroxylamine to the nitroxyl radical.
Fig. 20.10.
Fig. 20.10.
Time course of total amount (nitroxyl radical form + hydroxylamine form) of a contrast agent, carbamoyl-PROXYL, in normal and tumor tissues after i.v. injection.
Fig. 20.11.
Fig. 20.11.
Nitroxyl-induced T1 contrast at the head part of mice. a TEMPOL, b CxP-M, c carbamoyl-PROXYL, and d CxP showed difference of distribution in brain region.
Fig. 20.12.
Fig. 20.12.
Time-course SPGR MR images of rat head region after injection of a CxP-M (cell-permeable) and b CxP (cell-impermeable). Contrast agents were injected 2 min after the MR scan was started. Sixty serial images were obtained in 20 min. The SPGR MR parameters were as follows: image resolution was 256 × 128 zero-filled to 256 × 256 (0.125 mm resolution), FOV = 3.2 × 3.2 cm, slice thickness = 2.0 and 0.2 mm gap. The number of slices was six. The green color shows % enhancement of MR signal intensity, ΔM%. The time courses of intensity change of c CxP-M and d CxP in the ROI of cerebral cortex (red color) and thalamus (blue color) are shown. e Intensity change of CxP-M without blood flow is shown. KCI (2 mL) was injected 40 s after CxP-M injection and rats died within 20 s.
Fig. 20.13.
Fig. 20.13.
MRI signal dynamic of a SLENU and b SLCNUgly in the brain and surrounding tissues after i.v. injection in mice (0.4 mmol/kg b.w.). Each image was obtained within 20-s intervals using a Gradient-echo T1-weighted MRI. The red color in the images is the extraction of the signal between every single slide and the averaged baseline signal (first five slides – before injection). The red and black colors in the chart represent the MRI signal dynamic in the brain or entire area, respectively. A representative image from three independent experiments is shown in the figure.

References

    1. Sano H, Matsumoto K, Utsumi H. Synthesis and imaging of blood-brain-barrier permeable nitroxyl-probes for free radical reactions in brain ofliving mice. Biochem Mol Biol Int 1997;42:641–647. - PubMed
    1. Sano H, Naruse M, Matsumoto K, Oi T, Utsumi H. A new nitroxyl-probe with high retention in the brain and its application for brain imaging. Free Radie Biol Med 2000;28:959–969. - PubMed
    1. Samuni AM, DeGraff W, Krishna MC, Mitchell JB Nitroxides as antioxidants: Tempol protects against EO9 cytotoxicity. Mol Cell Biochem 2002;234/235:327–333. - PubMed
    1. Krishna MC, Grahame DA, Samuni A, Bitchell JB, Russo A. Oxoammonium cation intermediate in the nitroxide-catalyzed dismutation of superoxide. Proc Natl Acad Sci USA 1992;89:5537–5541. - PMC - PubMed
    1. Ui I, Okajo A, Endo K, Utsumi H, Matsumoto K. Effect of hydrogen peroxide in redox status estimation using nitroxyl spin probe. Free Radie Boil Med 2004;37:2012–2017. - PubMed