. 2011 May;129(5):563-71.
doi: 10.1007/s00439-011-0956-2. Epub 2011 Jan 30.

Genetic analysis of biological pathway data through genomic randomization

Affiliations

Genetic analysis of biological pathway data through genomic randomization

Brian L Yaspan et al. Hum Genet. 2011 May.

Abstract

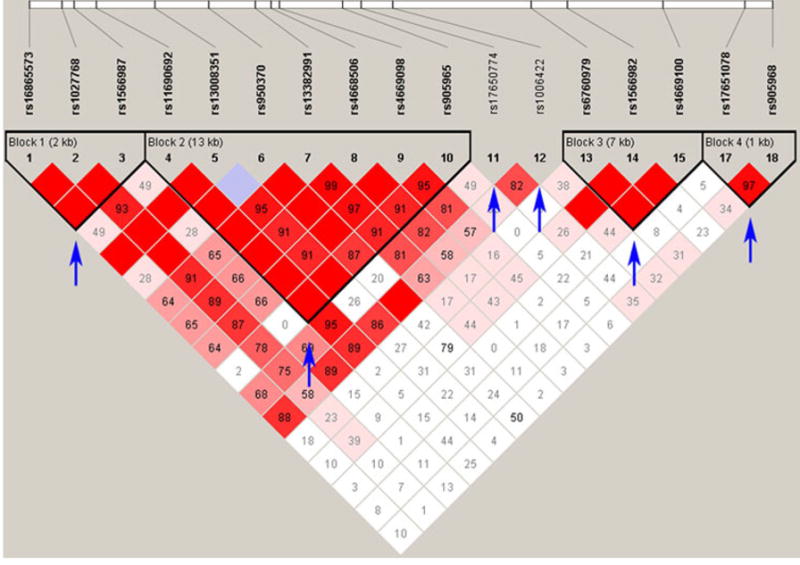
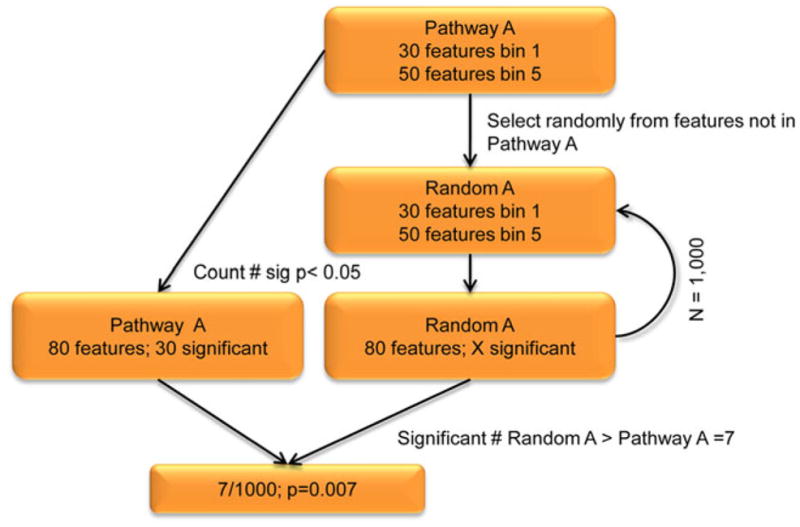
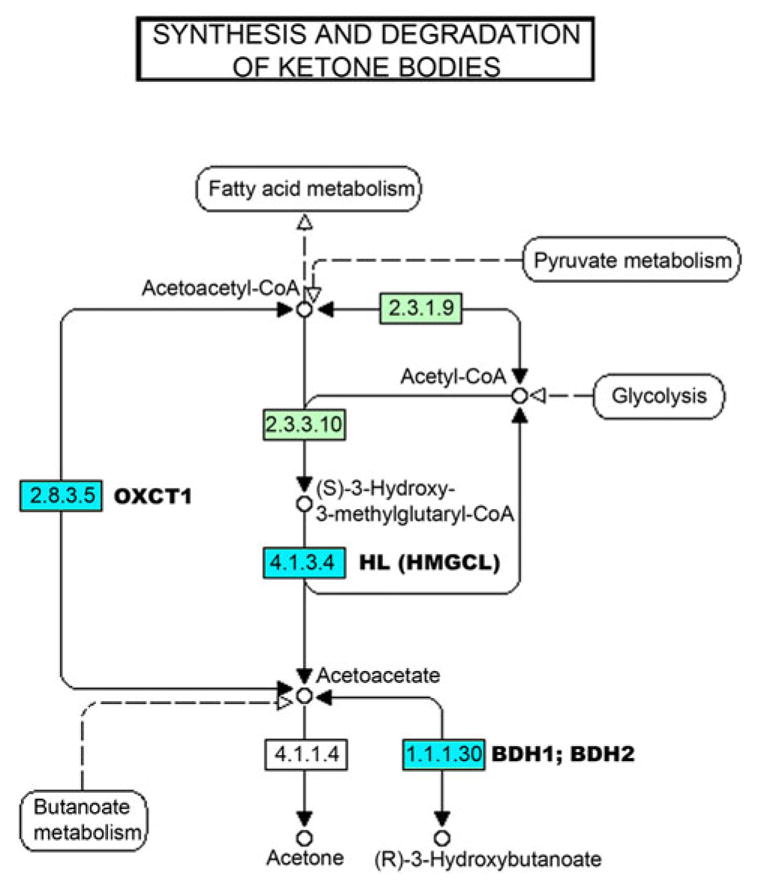
Genome Wide Association Studies (GWAS) are a standard approach for large-scale common variation characterization and for identification of single loci predisposing to disease. However, due to issues of moderate sample sizes and particularly multiple testing correction, many variants of smaller effect size are not detected within a single allele analysis framework. Thus, small main effects and potential epistatic effects are not consistently observed in GWAS using standard analytical approaches that consider only single SNP alleles. Here, we propose unique methodology that aggregates variants of interest (for example, genes in a biological pathway) using GWAS results. Multiple testing and type I error concerns are minimized using empirical genomic randomization to estimate significance. Randomization corrects for common pathway-based analysis biases, such as SNP coverage and density, linkage disequilibrium, gene size and pathway size. Pathway Analysis by Randomization Incorporating Structure (PARIS) applies this randomization and in doing so directly accounts for linkage disequilibrium effects. PARIS is independent of association analysis method and is thus applicable to GWAS datasets of all study designs. Using the KEGG database as an example, we apply PARIS to the publicly available Autism Genetic Resource Exchange GWAS dataset, revealing pathways with a significant enrichment of positive association results.


Figures

Fig. 1
Fig. 1. Visual representation of genomic ‘features.’
Depicted is an interval on chromosome 2 containing 18 SNPs. After applying the algorithm of Gabriel et. al, as implemented in Haploview, we identified four regions of LD and two SNPs that do not reside in areas of LD (denoted by arrows). Thus, this region of the genome has four LD features and two LE features for a total of six features. On the matrix, red indicates D′ = 1 (LOD ≥ 2), periwinkle indicates D′ = 1 (LOD < 2), shades of pink indicate D′ < 1 (LOD ≥ 2), and white indicates D′ < 1 (LOD < 2). Numbers in the squares indicate the r2 value between the two SNPs tested. A blank red square indicates an r2=1
Fig. 2
Fig. 2. Flowchart describing overall methodology of significance assignment to a pathway
As an example, we analyze “Pathway A”, consisting of 80 total features (30 from bin 1 and 50 from bin 5). We consider a feature significant if any SNP found within has a p<0.05, and perform 1,000 permutation tests to assign significance to Pathway A. In our example Pathway A, we count 30 significant features. We randomly select from bins 1 (n=30 features) and 5 (n=50 features) to mimic the structure of Pathway A, creating “Random A”. Features are selected without replacement. We then count the number of significant features in Random A, replacing all features to their respective bins for the next iteration. We then create 999 more Random A pathways, tallying the number of times there are more significant features (p<0.05) in Random A than in Pathway A. This happens seven times in our hypothetical example giving us a p-value for Pathway A of 0.007.
Fig. 3
Fig. 3. Visual representation of hsa0072: Synthesis and degradation of ketone bodies
Modified from the Kyoto Encyclopedia of Genes and Genomes website(http://www.genome.jp/kegg-bin/show_pathway?hsa00072) (Kanehisa and Goto, 2000), we present a visual depiction of the data from Table 4. In green are genes annotated in the KEGG database, in white are genes not annotated in the KEGG database. In blue are genes that show nominal significance in the “Gene p-value” test in the detailed pathway analysis, and the gene symbols for the nominally significant genes are listed beside the KEGG annotation. Genes that were not nominally associated, but in the pathway are: 2.3.1.9 = ACAT1 and ACAT2; 2.3.3.10 = HMGCS1 and HMGCS2; 2.8.3.5 = OXCT2.

References

    1. Askland K, Read C, Moore J. Pathways-based analyses of whole-genome association study data in bipolar disorder reveal genes mediating ion channel activity and synaptic neurotransmission. Hum Genet. 2009;125:63–79. - PubMed
    1. Barrett JC, Fry B, Maller J, Daly MJ. Haploview: analysis and visualization of LD and haplotype maps. Bioinformatics. 2005;21:263–265. - PubMed
    1. Blatt GJ. GABAergic cerebellar system in autism: a neuropathological and developmental perspective. Int Rev Neurobiol. 2005;71:167–178. - PubMed
    1. Delahanty RJ, Kang JQ, Brune CW, Kistner EO, Courchesne E, Cox NJ, Cook EH, Jr, Macdonald RL, Sutcliffe JS. Maternal transmission of a rare GABRB3 signal peptide variant is associated with autism. Mol Psychiatry 2009 - PMC - PubMed
    1. Dhossche D, Applegate H, Abraham A, Maertens P, Bland L, Bencsath A, Martinez J. Elevated plasma gamma-aminobutyric acid (GABA) levels in autistic youngsters: stimulus for a GABA hypothesis of autism. Med Sci Monit. 2002;8:R1–R6. - PubMed

Publication types

MeSH terms

LinkOut - more resources