. 2011 Apr 1;519(5):933-56.
doi: 10.1002/cne.22559.

Reassessment of the structural basis of the ascending arousal system

Affiliations

Reassessment of the structural basis of the ascending arousal system

Patrick M Fuller et al. J Comp Neurol. .

Erratum in

  • J Comp Neurol. 2011 Dec 15;519(18):3817. Fuller, Patrick [corrected to Fuller, Patrick M]

Abstract

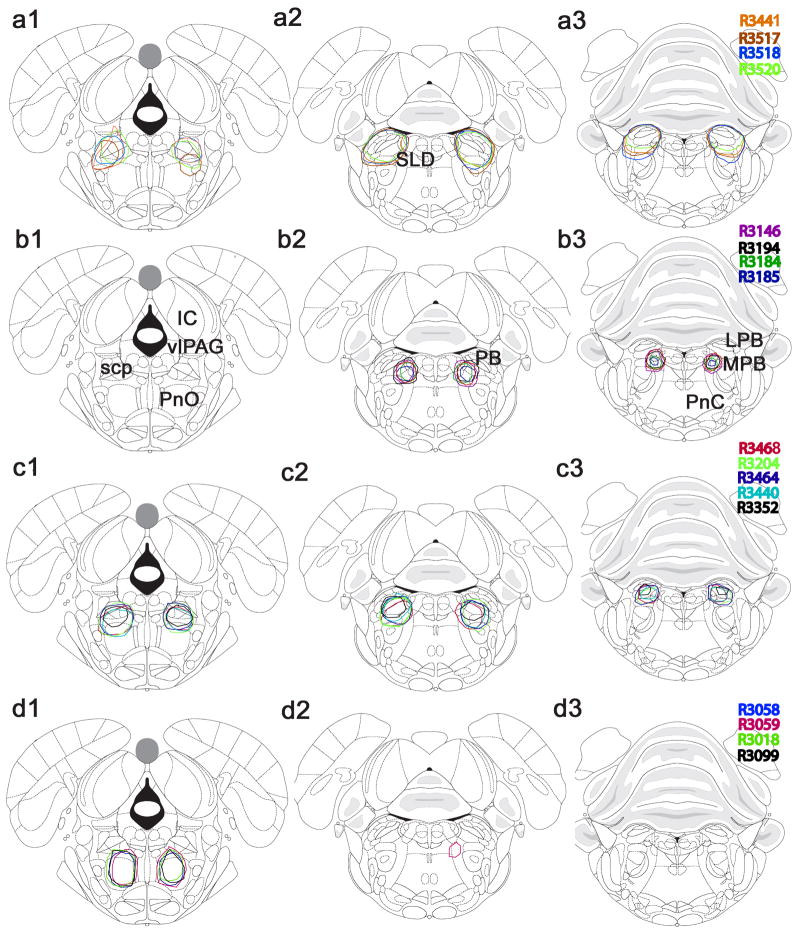
The "ascending reticular activating system" theory proposed that neurons in the upper brainstem reticular formation projected to forebrain targets that promoted wakefulness. More recent formulations have emphasized that most neurons at the pontomesencephalic junction that participate in these pathways are actually in monoaminergic and cholinergic cell groups. However, cell-specific lesions of these cell groups have never been able to reproduce the deep coma seen after acute paramedian midbrain lesions that transect ascending axons at the caudal midbrain level. To determine whether the cortical afferents from the thalamus or the basal forebrain were more important in maintaining arousal, we first placed large cell-body-specific lesions in these targets. Surprisingly, extensive thalamic lesions had little effect on electroencephalographic (EEG) or behavioral measures of wakefulness or on c-Fos expression by cortical neurons during wakefulness. In contrast, animals with large basal forebrain lesions were behaviorally unresponsive and had a monotonous sub-1-Hz EEG, and little cortical c-Fos expression during continuous gentle handling. We then retrogradely labeled inputs to the basal forebrain from the upper brainstem, and found a substantial input from glutamatergic neurons in the parabrachial nucleus and adjacent precoeruleus area. Cell-specific lesions of the parabrachial-precoeruleus complex produced behavioral unresponsiveness, a monotonous sub-1-Hz cortical EEG, and loss of cortical c-Fos expression during gentle handling. These experiments indicate that in rats the reticulo-thalamo-cortical pathway may play a very limited role in behavioral or electrocortical arousal, whereas the projection from the parabrachial nucleus and precoeruleus region, relayed by the basal forebrain to the cerebral cortex, may be critical for this process.


Figures

Figure 1
Figure 1
Effects of ibotenic acid lesions of the thalamus on arousal-induced Fos expression and cortical EEG. (a) A series of sections through the thalamus of one rat (R3598) from rostral to caudal levels demonstrating the typical extensive lesion (demarcated by black line), sparing only the most lateral part of the ventroposterior complex, lateral and medial geniculate nuclei, and parts of the reticular nucleus. Fos expression (black nuclei) in the neocortex (b), the TMN (c) and LC (d) in R3598 after 2 hr of behavioral arousal was similar to that seen in a control rat (e-g; brown stain in g is tyrosine hydroxylase immunohistochemistry). Panels h-l demonstrate the sleep-wake physiology of a rat sustaining a full thalamic lesion. (h) The EEG (top panel) and EMG (bottom panel) traces from such a rat during a 30 minute period containing both wake (W) and NREM sleep (N) bouts. The middle panel in (h) shows the relative magnitude and changes in delta (δ; green trace) and theta (θ; black trace) power during this recording window. Panels i and j show representative 20-sec EEG epochs and k and l demonstrate the associated power spectra from an athalamic rat during wakefulness* (i, k) and sleep** (j, l). In these power spectra and the ones that follow, EEG power is shown on the y axis in arbitrary units, and the frequency band (Hz) on the x-axis. Scale bar for i and j = 80μV.
Figure 2
Figure 2
Cell-body specific lesions were placed in the rat thalamus by injecting ibotenic acid bilaterally. The extent of the lesions in eight rats are shown, including four rats (R3254, R3597, R3598, R3599) with the most extensive lesions and four rats with less extensive lesions (R3104, R3221, R3230, and R3231, marked by asterisk, *). The four rats with the most extensive lesions (typically sparing only the most lateral part of the ventroposterior complex, lateral and medial geniculate nuclei, and parts of the reticular nucleus) were used in the analysis. Remarkably, rats sustaining even the most extensive thalamic lesions evidenced minimal changes in sleep-wake physiology.
Figure 3
Figure 3
Effects of cell-body selective lesions of the thalamus, BF cholinergic and non-cholinergic neurons, and the lateral and medial PB on the NREM, REM and waking EEG and associated power spectra. Panel a shows the sleep-wake EEG and associated power spectrum from an unlesioned rat. The remaining panels show the sleep-wake EEG and associated power spectrum from rats sustaining lesions of the (b) thalamus, (c) cholinergic BF neurons, (d) non-cholinergic BF neurons, (e) lateral parabrachial nucleus and (f) medial parabrachial nucleus. The power spectra in each state from the lesioned animals exhibit remarkably little difference from the unlesioned controls shown in Panel a. By contrast, combined cholinergic and non-cholinergic MBN lesions and complete PB-PC lesions produced a monotonous EEG with frequencies in the sub-delta range (cf. Panel a and Fig 5. f–g and Fig10. j–l).
Figure 4
Figure 4
Normalized power spectra across 12 hours during either the light period (a) or the dark period (b) in control rats and ones with lesions of the thalamus (Tha), basal forebrain (BF), or parabrachial nucleus (PB). Note that the thalamic lesions caused only a loss of theta power, which was most marked during the dark period. The basal forebrain and parabrachial lesions caused extensive loss of EEG activity above the frequency of 1 Hz, with very little remaining EEG power above 4 Hz (i.e., above the delta range).
Figure 5
Figure 5
Effects of non-selective lesions of the BF on the EEG pattern and Fos expression induced by continuous stimulation (gentle touching). In (a1-a4), a series of sections (stained immunohistochemically, brown, for ChAT, with a blue thionin counterstain) is shown arranged in rostro-caudal order through the BF in a rat with bilateral lesions using orexin-saporin (125 ng total), which killed 88% of the cholinergic neurons and virtually all non-cholinergic neurons in the BF. (b) An enlarged view of the area in the red box in (a3). Note that in the center of the lesion field (upper part of panel b) there are few if any surviving neurons remaining, whereas in the lower part of the panel, at the edge of the lesion area, about a dozen cholinergic cells (arrows) are the only surviving neurons in the field, which is otherwise filled with small glial nuclei. (c) Neocortical Fos expression after two-hours of sensory stimulation. A low level of Fos expression was seen in the neocortex, despite elevated Fos activity in the TMN (d) and the LC (e). (f) EEG following BF ablation (i.e., during the coma-like state) demonstrated monotonous <1.0 Hz oscillation across all behaviors. The left panel (f) shows 12 sec of EEG (at the time indicated by the arrow in panel h) and the right panel (g) shows a power spectrum for this 12 sec period. Note that the only peak is in the sub-delta range. Panel (h) shows 20 min of EEG/EMG in this behaviorally unresponsive state. Note that the delta power (green) remains uniformly high and the theta power (magenta) low, even during brief abortive movements (spikes in the EMG trace). Scale bars in f = 2 sec (horizontal), 50μV (vertical).
Figure 6
Figure 6
Cell-body specific lesions were placed in the rat basal forebrain by injecting either IgG192-saporin or orexin-saporin into the MCPO, SI and MS. The extent of the lesions in eleven rats are shown, including seven rats (R3312, R3213, R3333, R3296, R3297, R3298, R3480) with the most extensive lesions and four rats (marked by asterisk, *) with less extensive lesions (R3380, R3429, R3579, R3580). The seven rats with the most extensive lesions demonstrated near complete loss of cholinergic and non-cholinergic neurons in the MBN and all exhibited a coma-like state. The four rats sustaining less extensive lesions did not exhibit a similar coma-like state.
Figure 7
Figure 7
Fos expression in the midline thalamus following natural sleep (a) or active waking (b), in a control rat, or following sensory stimulation during the coma-like state in rats with bilateral PB-PC (c) or BF lesions (d). Note that although both the BF and PB-PC lesions produced a similar coma-like state, the BF lesion did not prevent activation of the midline thalamic nuclei during sensory stimulation, whereas the PB/PC lesion did prevent this activation. These results suggest that the PB-PC complex but not the BF drives thalamic activation under normal conditions.
Figure 8
Figure 8
Effects of selective lesions of cholinergic neurons or non-cholinergic neurons in the BF on cortical arousal. Intraventricular injections of 192 IgG-saporin (1 μg) killed more than 95% of BF cholinergic neurons shown by ChAT immunohistochemistry (brown). Only a few remaining ChAT-positive neurons were seen (a, arrows; see inset for higher power view of area just dorsal to arrows and showing brown, ChAT-positive neurons). In these animals, high levels of Fos immunoreactivity was induced in remaining neurons in the BF (a), as well as in the neocortex (b), the TMN (c), and the LC (d) following two-hours of behavioral stimulation. Lesions caused by lower dose injections of OX-SAP (100 ng total) spared most cholinergic neurons (stained brown for ChAT) but killed almost all other cells in the BF (e–f). The black lines outline the extent of the lesion, and there are few remaining large blue (non-cholinergic) neurons in the lesion area in these thionin counterstained sections. These animals also showed high levels of Fos in the TMN (g), the LC (h) and the neocortex (i) after behavioral arousal. The region of the lesion in one of these animals is shown by the green line in (j), and the locations of surviving cholinergic neurons by red dots (one dot = 12 cells).
Figure 9
Figure 9
Forebrain projections of the parabrachial nucleus (PB) and pre-coeruleus area (PC). (a) The retrograde tracer CTB (stained brown immunohistochemically) is shown in the substantia innominata (SI, see inset), and retrogradely labeled neurons (brown) are seen in both the PC and the adjacent medial PB (marked by arrows). (b) Double labeling with VGLUT2 mRNA radioisotopic in situ hybridization (black silver grains), after an injection of CTB into the SI (brown cells) shows that most neurons in the PB/PC that project to the BF express VGLUT2 mRNA (arrows). The inset shows an enlargement of two doubly-labeled neurons marked by arrows just below the box. (c) An illustration of the distribution of the CTB-labeled cells in the dorsolateral pontine region after an SI injection. Sections c1-c3 are arranged from rostral to caudal. Each dot = 3 cells.
Figure 10
Figure 10
Effects of cell-selective lesions of the dorsolateral pontine tegmentum on sleep and wakefulness. OX-SAP lesions of the MPB (a) caused an increase in the amount of both NREM and REM sleep during the dark period (Table 2, see also Lu et al., 2006). Lesions involving both the MPB and the PC (b) also showed loss of theta power in the EEG during REM sleep (see Lu et al., 2006). Larger lesions involving both the PC as well as the entire PB (c) caused coma with failure of continuous stimulation to activate Fos expression in the cerebral cortex (d) and reduced activation of the TMN (e; cf. fig. 8c or g), although Fos expression in the LC (f) was elevated. Panels g–l compare the physiology of a normal sleep-wake cycle (g–i) with the coma-like state (j–l). (g) shows a representative 12-sec EEG epoch and (h) associated power spectrum (epoch begins at red arrow shown in the EEG trace from (i)) from an intact rat during NREM sleep. (i) shows the EEG (top trace) and EMG (bottom trace) during a period of NREM sleep, then REM sleep and then wake. The middle trace demonstrates the relative magnitude and changes in delta (δ; green trace) and theta (θ; magenta trace) power during this recording window. (j) shows a representative 12-sec EEG epoch and (k) associated power spectrum (epoch begins at see red arrow shown in the EEG trace from (l)) from the same rat following a PB-PC lesion and the development of a ‘coma-like’ state. The EEG and power spectrum from the behaviorally unresponsive animal clearly shows the predominantly <1.0 Hz sub-delta activity and loss of theta. Note in (l) that the EEG is monotonous in range, with prominent delta activity throughout the trace, and low EMG activity indicating lack of spontaneous movement. Total window time for traces in (i) and (l) ca. 30 min (see time bar below l). (g) Vertical scale bar in (g) = 80μV and in (j) = 50μV, horizontal scale = 1 sec.
Figure 11
Figure 11
Cell-body specific lesions were place in the rat pontine tegmentum by injecting orexin-saporin bilaterally. The extent of the lesions in seventeen rats are shown, including (a1-a3) four rats with complete PB/PC lesions (R3441, R3517, R3518, R3520); (b1-b3) four (of 10) rats with bilateral lesions of the SLD which also damaged the MPB (R3146, etc.); (c1-c3) five (of 7) rats with MPB lesions (R3468, etc.); and (d1-d3) four rats with bilateral lesions of the paramedian rostral pontine reticular formation (R3058, etc.). All four rats sustaining complete lesions of the PB/PC complex became comatose. By contrast, MPB lesions and SLD lesions that included the MPB produced a significant increase in sleep (ca. 28%) and paramedian pontine reticular formation lesions did not affect total wake or sleep time. Additional bilateral control lesions of adjacent regions of the pontine tegmentum, including the LC, the PPT, and midline raphe nuclei produced little changes in the proportion of wakefulness or sleep as previously reported (Table 4 and Lu et al., 2006).
Figure 12
Figure 12
Collateral effects of orexin-saporin lesions of the PB/PC on adjacent pontine regions, including the LDT, PPT and LC. The three panels show sections through the LDT (a), PPT (b), and LC (c) from a comatose rat (R3517). Panels a and b show neurons stained for ChAT immunohistochemistry (brown) and blue Nissl counterstain; panel c shows only the counterstain. While the lesions variably encroached upon all three cell groups, in no case was there more than 50% bilateral cell loss in any of these cell groups. Scale bar = 100μm.

References

    1. Adametz JH. Rate of recovery of functioning in cats with rostral reticular lesions; an experimental study. J Neurosurg. 1959;16:85–97. - PubMed
    1. Adams JH, Graham DI, Murray LS, Scott G. Diffuse axonal injury due to nonmissile head injury in humans: an analysis of 45 cases. Ann Neurol. 1982;12:557–63. - PubMed
    1. Batini C, Moruzzi G, Palestini M, Rossi GF, Zanchetti A. Effects of complete pontine transections on the sleep-wakefulness rhythm: the midpontine pretri-geminal preparation. Arch Ital Biol. 1959;97:1–12.
    1. Berntson GG, Shafi R, Sarter M. Specific contributions of the basal forebrain corticopetal cholinergic system to electroencephalographic activity and sleep/waking behaviour. Eur J Neurosci. 2002;16:2453–61. - PubMed
    1. Berridge CW, Foote SL. Enhancement of behavioral and electroencephalographic indices of waking following stimulation of noradrenergic beta-receptors within the medial septal region of the basal forebrain. J Neurosci. 1996;16:6999–7009. - PMC - PubMed

Publication types

MeSH terms

Substances