. 2011 Feb 2;100(3):602-610.
doi: 10.1016/j.bpj.2010.12.3711.

Molecular dynamics studies of ion permeation in VDAC

Affiliations

Molecular dynamics studies of ion permeation in VDAC

Huan Rui et al. Biophys J. .

Abstract

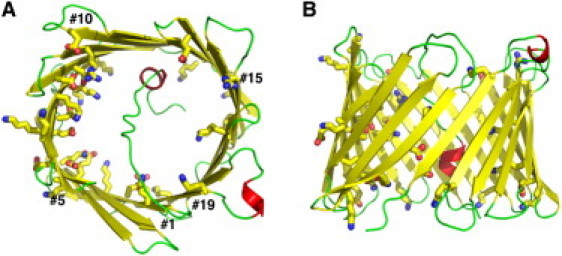
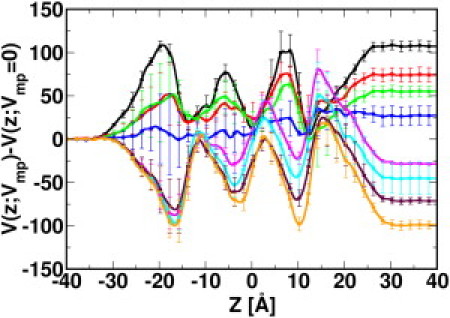
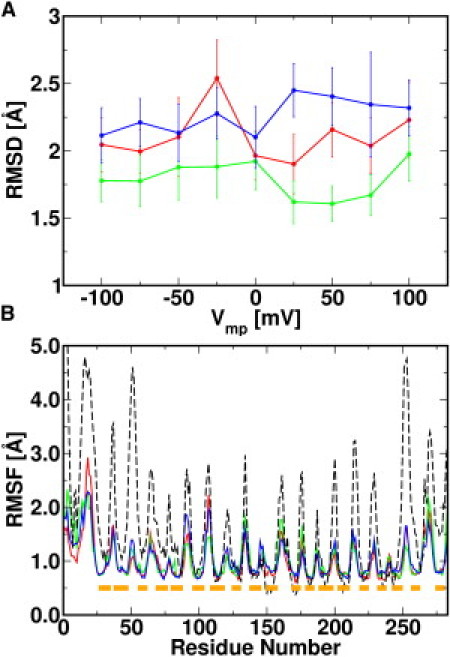
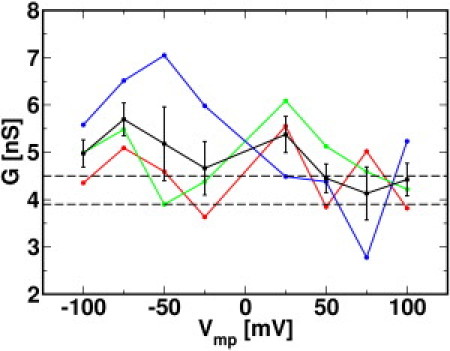
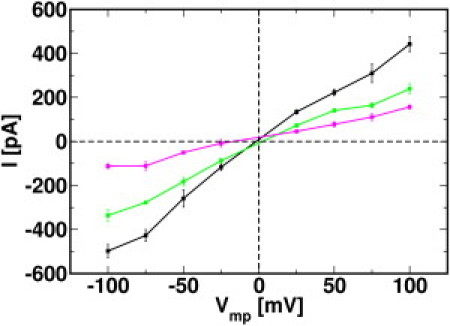
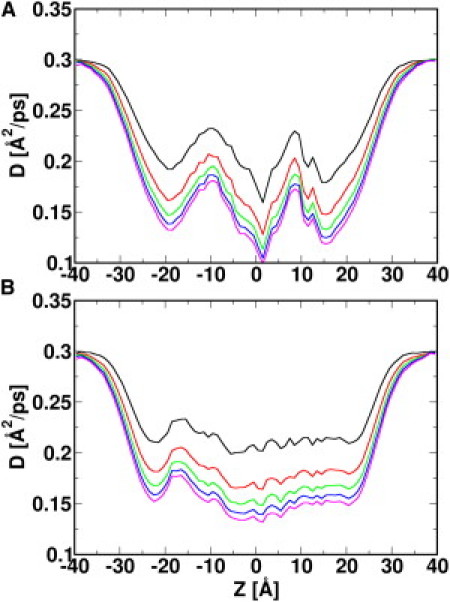
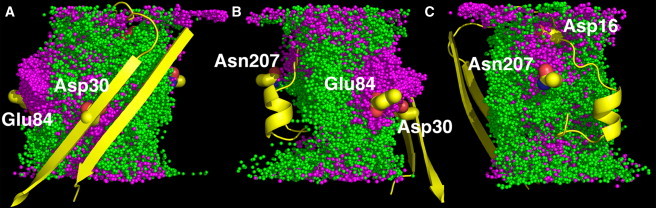
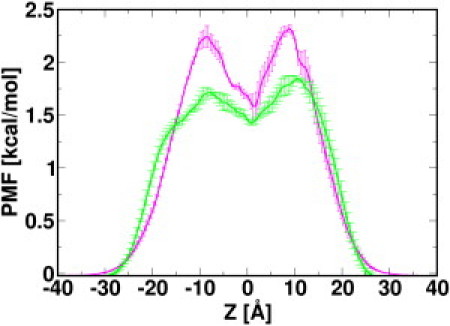
The voltage-dependent anion channel (VDAC) in the outer membrane of mitochondria serves an essential role in the transport of metabolites and electrolytes between the cell matrix and mitochondria. To examine its structure, dynamics, and the mechanisms underlying its electrophysiological properties, we performed a total of 1.77 μs molecular dynamics simulations of human VDAC isoform 1 in DOPE/DOPC mixed bilayers in 1 M KCl solution with transmembrane potentials of 0, ±25, ±50, ±75, and ±100 mV. The calculated conductance and ion selectivity are in good agreement with the experimental measurements. In addition, ion density distributions inside the channel reveal possible pathways for different ion species. Based on these observations, a mechanism underlying the anion selectivity is proposed; both ion species are transported across the channel, but the rate for K(+) is smaller than that for Cl(-) because of the attractive interactions between K(+) and residues on the channel wall. This difference leads to the anion selectivity of VDAC.


Figures

Figure 1
Figure 1
Molecular representation of hVDAC1 from the first NMR model (PDB:2K4T). Top view (A) and side view (B) showing α-helices (red), β-strands (yellow), and loops (green). Charged residues that line the channel wall are highlighted in stick representations. The figures were produced using the molecular visualization program PyMOL (46).
Figure 2
Figure 2
Average electrostatic potential profiles of the systems with Vmp = −100 (black), −75 (red), −50 (green), −25 (blue), 25 (magenta), 50 (cyan), 75 (maroon), and 100 mV (orange) along the z axis. The average electrostatic potential profile from the systems with Vmp = 0 is subtracted from the original V(z; Vmp) profiles (Fig. S2) to illustrate the influence of the applied electric field on the electrostatic potential throughout the simulation system. The established potentials, i.e., V(−40; Vmp) − V(40; Vmp), during the simulations are −104±4, −72±5, −53±4, −25±7, 31±1, 48±11, 74±2, and 102±3 mV for Vmp = −100, −75, −50, −25, 25, 50, 75, and 100 mV.
Figure 3
Figure 3
(A) Average backbone RMSD in all systems for the last 60 ns, with S1 (red), S2 (green), and S3 (blue). (B) Backbone RMSF for systems S1_n100 (red), S1_0 (green), and S1_p100 (blue), and from 20 NMR models (PDB:2K4T) (black dash). The RMSF of the NMR models was calculated with respect to the average NMR structure. The residue span of the β-strands is shown in boxes (orange).
Figure 4
Figure 4
Conductance calculated from the last 60 ns in simulation sets S1 (red), S2 (green), and S3 (blue) as a function of applied voltage Vmp, with average conductance and standard error (black). The dashed lines indicate the range of experimental single-channel conductance.
Figure 5
Figure 5
Current-voltage (I/V) relationship for the total (black), K+ (magenta), and Cl (green) currents. The average current and standard error at each voltage point are calculated from three independent simulations.
Figure 6
Figure 6
Diffusion constant profiles for K+ (A) and Cl (B) along the z axis. The diffusion constant D(z) is calculated using different time intervals: τ = 1 ps (black), 2 ps (red), 3 ps (green), 4 ps (blue), and 5 ps (magenta). Using time intervals τ = 4 ps and τ = 5 ps, a 50% decrease of D is observed when ions move from the bulk region to the VDAC pore region.
Figure 7
Figure 7
Overlay of ion trajectories for the last 10 ns of simulations in S1_n100. The trajectories are sampled every 10 ps, resulting in a superposition of 1000 snapshots. (AC) Three different views by 120° rotation. K+ (magenta) and Cl (green) are shown as spheres. To indicate the positions of involved residues, a reference segment (yellow) of the channel is also shown, including residues numbered 1 to 36 and 273 to 285. Important residues (yellow) such as Asp16, Asp30, Glu84, and Asn207 are presented in stick representation.
Figure 8
Figure 8
The averaged one-dimensional multi-ion PMF for K+ (magenta) and Cl (green), calculated from simulations at zero TM potential.

Similar articles

Cited by

References

    1. Hodge T., Colombini M. Regulation of metabolite flux through voltage-gating of VDAC channels. J. Membr. Biol. 1997;157:271–279. - PubMed
    1. Lindén M., Gellerfors P., Nelson B.D. Pore protein and the hexokinase-binding protein from the outer membrane of rat liver mitochondria are identical. FEBS Lett. 1982;141:189–192. - PubMed
    1. Shimizu S., Narita M., Tsujimoto Y. Bcl-2 family proteins regulate the release of apoptogenic cytochrome c by the mitochondrial channel VDAC. Nature. 1999;399:483–487. - PubMed
    1. Decker W.K., Bowles K.R., Craigen W.J. Revised fine mapping of the human voltage-dependent anion channel loci by radiation hybrid analysis. Mamm. Genome. 1999;10:1041–1042. - PubMed
    1. Sampson M.J., Decker W.K., Craigen W.J. Immotile sperm and infertility in mice lacking mitochondrial voltage-dependent anion channel type 3. J. Biol. Chem. 2001;276:39206–39212. - PubMed

Publication types

LinkOut - more resources