. 2011 Mar 15;71(6):2118-28.
doi: 10.1158/0008-5472.CAN-10-2426. Epub 2011 Jan 31.

CARM1 is an important determinant of ERα-dependent breast cancer cell differentiation and proliferation in breast cancer cells

Affiliations

CARM1 is an important determinant of ERα-dependent breast cancer cell differentiation and proliferation in breast cancer cells

Mariam Al-Dhaheri et al. Cancer Res. .

Abstract

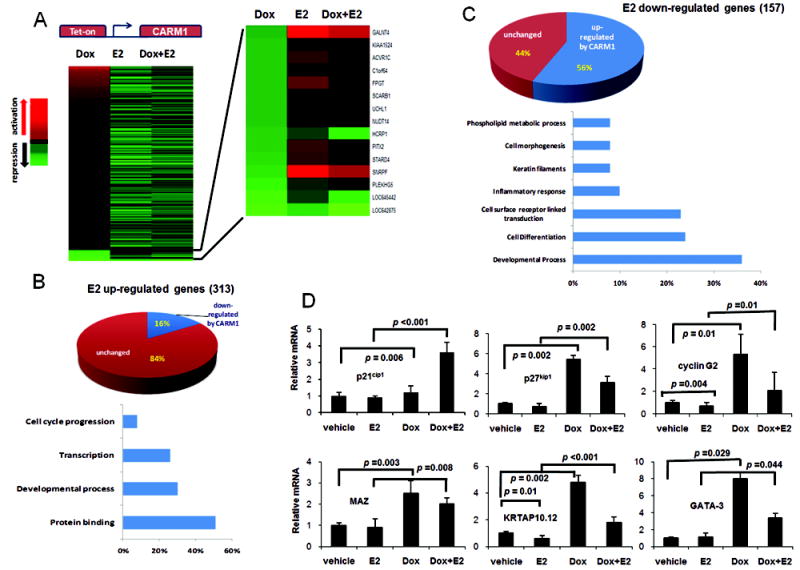
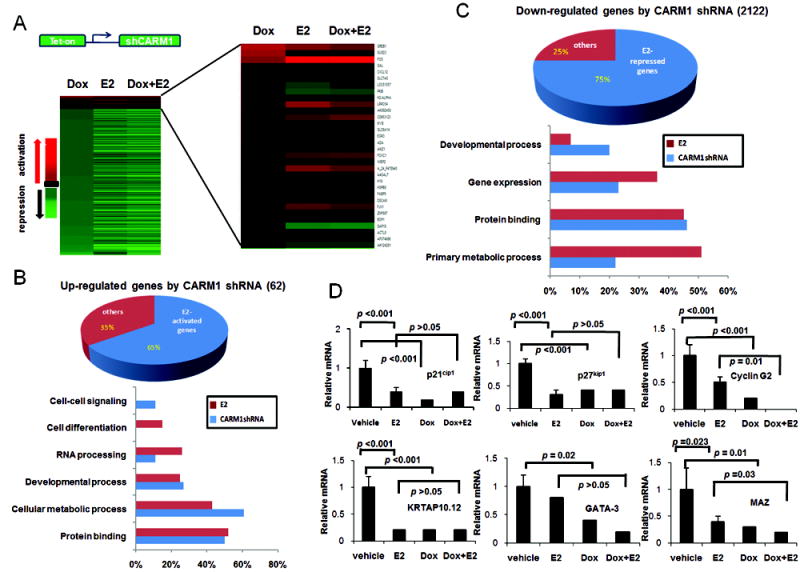
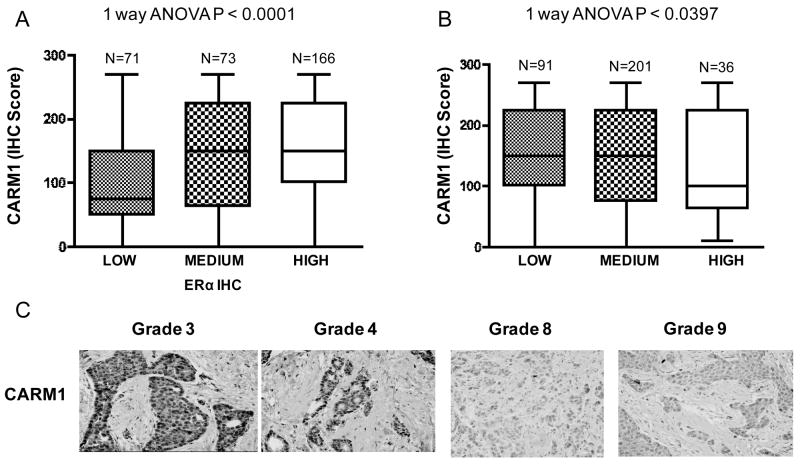
Breast cancers with estrogen receptor α (ERα) expression are often more differentiated histologically than ERα-negative tumors, but the reasons for this difference are poorly understood. One possible explanation is that transcriptional cofactors associated with ERα determine the expression of genes which promote a more differentiated phenotype. In this study, we identify one such cofactor as coactivator-associated arginine methyltransferase 1 (CARM1), a unique coactivator of ERα that can simultaneously block cell proliferation and induce differentiation through global regulation of ERα-regulated genes. CARM1 was evidenced as an ERα coactivator in cell-based assays, gene expression microarrays, and mouse xenograft models. In human breast tumors, CARM1 expression positively correlated with ERα levels in ER-positive tumors but was inversely correlated with tumor grade. Our findings suggest that coexpression of CARM1 and ERα may provide a better biomarker of well-differentiated breast cancer. Furthermore, our findings define an important functional role of this histone arginine methyltransferase in reprogramming ERα-regulated cellular processes, implicating CARM1 as a putative epigenetic target in ER-positive breast cancers.


Figures

Figure 1
Figure 1
Overexpression of CARM1 inhibits growth and colony formation of MCF7 while exhibiting no effect on MDA-MB-231. (A) The CARM1-overexpressing MCF7 cell line (MCF7-CARM1) grew at a slower rate than the MCF7-vector control as measured by MTT. Error bars denote the standard error deviation (STDEV) (n=3). (B) p21cip1 and p27kip1 were expressed at higher levels in MCF7-CARM1 than in MCF7-vector cells in the presence of 10 nM E2. (C) Overexpression of CARM1 inhibited colony formation of MCF7-CARM1 in soft agar in the presence of 10 nM E2. The inset shows colonies under higher amplification in MCF7-vector cells. (D) Neither overexpressing nor knocking-down CARM1 has growth effects on MDA-MB-231. Each assay was performed in triplicate and the error bars represent the STDEV. (E) Western blotting showed that CARM1 was overexpressed in MDA-MB-231-CARM1 and knocked down in MDA-MB-231-shCARM1 cells.
Figure 2
Figure 2
CARM1 inhibits E2-dependent MCF7 cell growth and S-phase entry. MCF7-tet-on-CARM1 (A) and MCF7-tet-on-shCARM1 (B) tetracycline-inducible cell lines were constructed as gain-of-function and loss-of-function cell-based models to modulate the endogenous level of CARM1. CARM1 was detected by Western blotting and mRNA was determined by Q-RT PCR. * indicates statistically significant p value. (C) Inhibition of E2-dependent cell growth by overexpressing CARM1 (+Dox) in MCF7-tet-on-CARM1. Bars denote the STDEV (n=9). (D) Knocking down CARM1 in MCF7-tet-on-shCARM1 (+Dox) did not affect the basal and E2-dependent growth of MCF7 cells in MTT assays. Bars denote the STDEV (n=9). (E) E2 increased the S-phase entry, an event inhibited by CARM1 overexpression in MCF7-tet-on-CARM1 cells. (F) The effects of CARM1 overexpression or knock-down on E2-dependent S-phase entry (p>0.05) measured by BrdU labeling. Error bars indicate STDEV (n=3).
Figure 3
Figure 3
Overexpression of CARM1 induces morphological changes in MCF7 characteristic of a differentiated phenotype. (A) MCF7-CARM1 and MCF7-vector cells exhibit different morphology. (B) DSP1 mRNA level was significantly repressed by E2 treatment and overexpression of CARM1 could reverse E2-mediated DSP1 repression. Error bars indicate STDEV from triplicate experiments. (C) Western blots showed that overexpression CARM1 restored protein levels of E2-repressed E-cadherin and GATA3 at 12 hrs after E2 treatment.
Figure 4
Figure 4
Overexpression of CARM1 modulates E2-dependent gene signature. (A) The ratios of normalized intensities for Dox, E2, or Dox+E2 treated samples vs. that of samples treated with control vehicle (Dox vs DMSO, E2 vs DMSO, and DOX+E2 vs DMSO) were used to demonstrate the activation or repression. Heat map of gene expression calculated as fold changes compared to vehicle indicated that CARM1-induced genes (+Dox) are largely non-overlapping with E2-activated genes. Among CARM1 repressed genes, many are activated by E2 (see blow-up of the heat map), indicating that overexpressing CARM1 can inhibit some E2-activated genes. (B) Pie graphshows that among all E2-upregulated genes, 16% of them are down-regulated by CARM1 overexpression. The bottom of chart shows, among all CARM1-downregualated, E2-upregulated genes, the percentage of genes in each molecular function category.Gene ontology (GO) of the affected genes were determined by GOStat tool online (http://gostat.wehi.edu.au/cgi-bin/goStat.pl),“goa_human” database, where % represent the % of the affected genes that belong to each represented category. (C) Pie graph shows that among all E2 down-regulated genes, 56% of them are up-regulated by CARM1 overexpression. The bottom chart shows, among all CARM1-upregulated, E2-down-regulated genes, the percentage of genes in each molecular function category. (D) Q-RT PCR analyses of p21cip1, p27kip1, cyclin G2, MAZ, KRTAP10.12 and GATA-3 expression in MCF7-tet-on-CARM1. Error bars indicate STDEV from three independent experiments.
Figure 5
Figure 5
Knocking-down CARM1 shared common gene signatures with that of E2 treatment in MCF7-tet-on-shCARM1. (A) Heat map showed that CARM1 shRNA (+Dox) activated and repressed genes were largely overlapping with those regulated by E2. A blow-up of the heat map illustrated that many Dox-activated genes (knocking down CARM1) were also activated by E2. (B) Pie graph shows that ~ 65% of CARM1 shRNA activated genes were also activated by E2; ~ 35% of knocking down CARM1 activated genes was E2 non-responsive (labeled as others). Gene ontology illustrated the top affected gene categories by expressing CARM1shRNA or E2 treatment. (C) Pie graph shows that among all down-regulated genes by CARM1 knock-down, 75% of them are E2-repressed genes and 25% of them are E2-non-responsive (labeled as others). The bottom chart shows, among all down-regulated genes by E2 treatment or CARM1 knock-down, the percentage of genes in each molecular function category. (D) Quantitative RT-PCR analyses of ER target genes in MCF7-tet-on-shCARM1. Error bars indicate STDEV.
Figure 6
Figure 6
Knocking-down CARM1 increased E2-dependent tumor growth in xenografted mice. (A) Schematic design of the xenograft study using MCF7-tet-on-shCARM1 cell line. (B) CARM1 mRNA and protein levels were decreased in tumors from Dox recipient mice. CARM1 mRNA in tumors was quantified using Q-RT PCR (vehicle n=7, Dox n=10); protein was visualized by IHC. (C) Increased tumor volume in CARM1 knocked down mice. A representative experiment showed a higher tumor volume with knocking down CARM1 (n=10) compared to E2 alone induced tumors (n=8). The red arrows point to tumors in two representative mice. (D) BrdU and H&E staining of representative tumor samples from vehicle and Dox treated mice. (E) Mitotic index of representative tumor samples from vehicle and Dox treated mice implanted with a high dose E2 pellets. (F) Correlation of p21cip1 and E-cadherin protein level by IHC.
Figure 7
Figure 7
The expression level of CARM1 positively correlates with ERα level and inversely correlates with tumor grade in ER+ breast tumors. (A) CARM1 expression level is directly correlated with ERα expression level in more than 300 human breast tumor samples using tissue microarrays (TMA). (B & C) CARM1 expression level is higher in ER+, low-grade tumors compared to high grade tumors, supporting a potential link between CARM1 and the differentiation status of ERα-dependent breast tumors. ERα+ve, GRADE 3, 4 (LOW), IHC-SCORE 270, X500 MAGNIFICATION, ERα+VE, GRADE 8, 9 (HIGH), IHC-SCORE 0, X500 MAGNIFICATION.

References

    1. Ikeda K, Inoue S. Estrogen receptors and their downstream targets in cancer. Arch Histol Cytol. 2004;67:435–42. - PubMed
    1. Foster JS, Henley DC, Bukovsky A, Seth P, Wimalasena J. Multifaceted regulation of cell cycle progression by estrogen: regulation of Cdk inhibitors and Cdc25A independent of cyclin D1-Cdk4 function. Mol Cell Biol. 2001;21:794–810. - PMC - PubMed
    1. Doisneau-Sixou SF, Sergio CM, Carroll JS, Hui R, Musgrove EA, Sutherland RL. Estrogen and antiestrogen regulation of cell cycle progression in breast cancer cells. Endocr Relat Cancer. 2003;10:179–86. - PubMed
    1. Creighton CJ, Cordero KE, Larios JM, et al. Genes regulated by estrogen in breast tumor cells in vitro are similarly regulated in vivo in tumor xenografts and human breast tumors. Genome Biol. 2006;7:R28. - PMC - PubMed
    1. Frasor J, Danes JM, Komm B, Chang KC, Lyttle CR, Katzenellenbogen BS. Profiling of estrogen up- and down-regulated gene expression in human breast cancer cells: insights into gene networks and pathways underlying estrogenic control of proliferation and cell phenotype. Endocrinology. 2003;144:4562–74. - PubMed

Publication types

MeSH terms

Substances

LinkOut - more resources