. 2011 Mar;60(3):784-96.
doi: 10.2337/db09-1907. Epub 2011 Jan 31.

Physical exercise reduces circulating lipopolysaccharide and TLR4 activation and improves insulin signaling in tissues of DIO rats

Affiliations

Physical exercise reduces circulating lipopolysaccharide and TLR4 activation and improves insulin signaling in tissues of DIO rats

Alexandre G Oliveira et al. Diabetes. 2011 Mar.

Retraction in

Expression of concern in

  • Expression of concern.
    [No authors listed] [No authors listed] Diabetes. 2015 Mar;64(3):1068-70. doi: 10.2337/db15-ec03. Diabetes. 2015. PMID: 25713202 Free PMC article. No abstract available.

Abstract

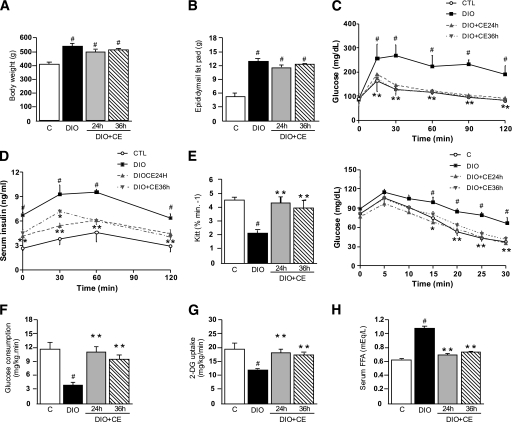
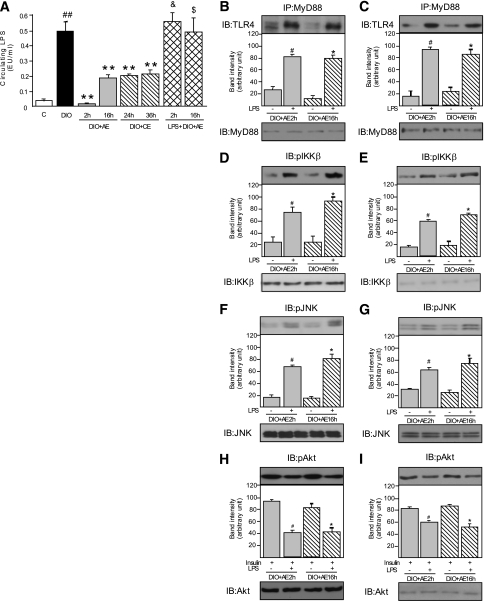
Objective: Insulin resistance in diet-induced obesity (DIO) is associated with a chronic systemic low-grade inflammation, and Toll-like receptor 4 (TLR4) plays an important role in the link among insulin resistance, inflammation, and obesity. The current study aimed to analyze the effect of exercise on TLR4 expression and activation in obese rats and its consequences on insulin sensitivity and signaling.

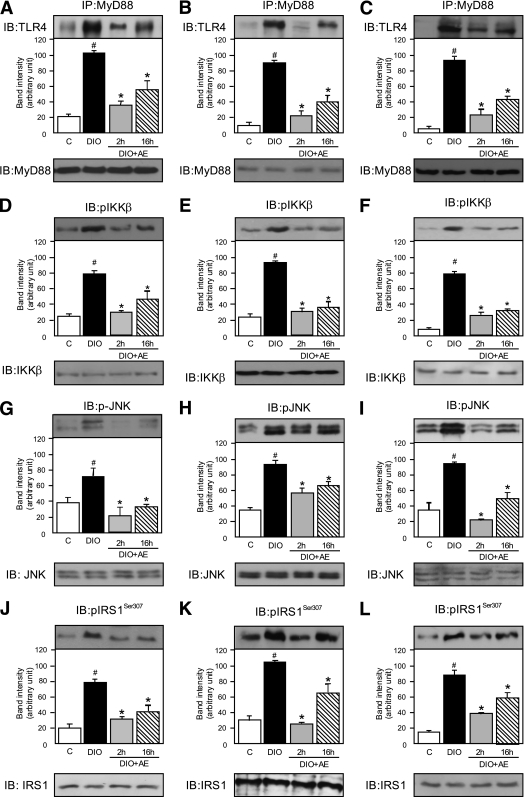
Research design and methods: The effect of chronic and acute exercise was investigated on insulin sensitivity, insulin signaling, TLR4 activation, c-Jun NH(2)-terminal kinase (JNK) and IκB kinase (IKKβ) activity, and lipopolysaccharide (LPS) serum levels in tissues of DIO rats.

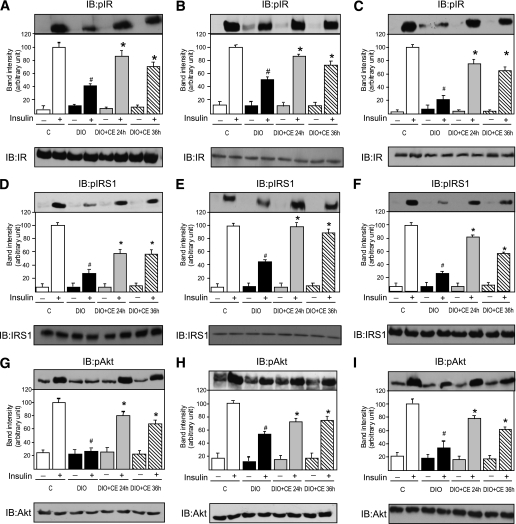
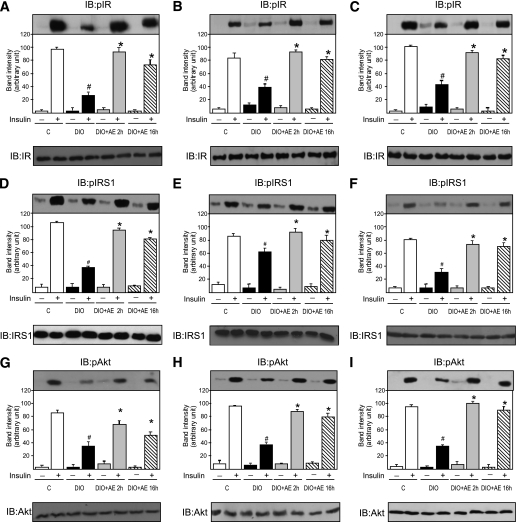
Results: The results showed that chronic exercise reduced TLR4 mRNA and protein expression in liver, muscle, and adipose tissue. However, both acute and chronic exercise blunted TLR4 signaling in these tissues, including a reduction in JNK and IKKβ phosphorylation and IRS-1 serine 307 phosphorylation, and, in parallel, improved insulin-induced IR, IRS-1 tyrosine phosphorylation, and Akt serine phosphorylation, and reduced LPS serum levels.

Conclusions: Our results show that physical exercise in DIO rats, both acute and chronic, induces an important suppression in the TLR4 signaling pathway in the liver, muscle, and adipose tissue, reduces LPS serum levels, and improves insulin signaling and sensitivity. These data provide considerable progress in our understanding of the molecular events that link physical exercise to an improvement in inflammation and insulin resistance.


Figures

FIG. 1.
FIG. 1.
Physiologic, metabolic, and insulin tolerance parameters in control rats, obese rats, and obese rats submitted to a chronic exercise protocol. A: Body weight. B: Epididymal fat pad weight. C: Glucose tolerance test after 20 weeks of a high-fat diet. D: Serum insulin levels during the glucose tolerance test after 20 weeks of the diet. E: Rate constant for insulin tolerance test and glucose response curve during the insulin tolerance test after 20 weeks of a high-fat diet. F: Steady-state glucose infusion rates obtained from averaged rates of 90–120 min of 10% unlabeled glucose infusion during hyperinsulinemic-euglycemic clamp procedures in the control rats, DIO rats, and DIO rats submitted to chronic exercise. G: Glucose transport in gastrocnemius muscle was evaluated by 2-deoxy-d-glucose uptake during the last 45 min of the hyperinsulinemic-euglycemic clamp studies. H: Serum FFA concentrations. Data are presented as means ± SEM of 10 rats per group. #P < 0.001 vs. control. *P < 0.05 vs. DIO. **P < 0.001 vs. DIO.
FIG. 2.
FIG. 2.
Effects of chronic exercise on TLR4 in obese Wistar rats. Representative blots show the expressions of TLR4 in muscle (A), liver (B), and adipose (C) of control, DIO, DIO+CE24h, and DIO+CE36h rats. Determination of the relative TLR4 mRNA expression by real-time PCR in muscle (D), liver (E), and adipose tissue (F) of control, DIO, DIO+CE24h, and DIO+CE36h rats. TLR4/MyD88 interaction in muscle (G), liver (H), and adipose (I) of control, DIO, DIO+CE24h, and DIO+CE36h rats (G–I, top). Total protein expression of MyD88 (G–I, bottom). IRAK-1 protein expression in muscle (J), liver (K), and adipose (L) of control, DIO, DIO+CE24h, and DIO+CE36h rats. Total protein expression of β-actin (J–K, bottom). Data are presented as means ± SE of 10 rats per group. #P < 0.05 vs. control group. *P < 0.05 vs. DIO. **P < 0.001 vs. DIO. IB, immunoblot; IP, immunoprecipitate.
FIG. 3.
FIG. 3.
Effects of chronic exercise on modulators of insulin signaling. Representative blots show the expressions of IKKβ phosphorylation in muscle (A), liver (B), and adipose (C) of control, DIO, DIO+CE24h, and DIO+CE36h rats (top). Total protein expression of IKKβ (A–C, bottom). Expression of JNK phosphorylation in muscle (D), liver (E), and adipose (F) of control, DIO, DIO+CE24h, and DIO+CE36h rats (D–F, top). Total protein expression of JNK (D–F, bottom). IRS-1 serine 307 phosphorylation in muscle (G), liver (H), and adipose (I) of control, DIO, DIO+CE24h, and DIO+CE36h rats (top). Total protein expression of IRS-1 (G–I, bottom). Data are presented as means ± SE of 10 rats per group. #P < 0.05 vs. control group. *P < 0.05 vs. DIO. IB, immunoblot.
FIG. 4.
FIG. 4.
Effects of chronic exercise on insulin signaling in rats fed a high-fat diet. Representative blots show tyrosine phosphorylation of IRβ in muscle (A), liver (B), and adipose (C) of control, DIO, DIO+CE24h, and DIO+CE36h rats (top). Total protein expression of IRβ (A–C, bottom). Tyrosine phosphorylation of IRS-1 in muscle (D), liver (E), and adipose (F) of control, DIO, DIO+CE24h, and DIO+CE36h rats (top). Total protein expression of IRS1 (D–F, bottom). Serine phosphorylation of Akt in muscle (G), liver (H), and adipose (I) of control, DIO, DIO+CE24h, and DIO+CE36h rats (top). Total protein expression of Akt (G–I, bottom). Data are presented as means ± SE of 10 rats per group. #P < 0.05 vs. control group. *P < 0.05 vs. DIO. IB, immunoblot.
FIG. 5.
FIG. 5.
Physiologic, metabolic, and insulin tolerance parameters of obese sedentary rats and obese rats submitted to an acute exercise protocol. A: Body weight. B: Epididymal fat pad weight. C: Glucose tolerance test after 20 weeks of a high-fat diet. D: Serum insulin levels during the glucose tolerance test after 20 weeks of the diet. E: Rate constant for insulin tolerance test and glucose response curve during the insulin tolerance test after 20 weeks of a high-fat diet. F: Steady-state glucose infusion rates obtained from averaged rates of 90–120 min of 10% unlabeled glucose infusion during hyperinsulinemic-euglycemic clamp procedures in the DIO sedentary rats and DIO rats submitted to acute exercise. G: Glucose transport in gastrocnemius muscle was evaluated by 2-deoxy-d-glucose uptake during the last 45 min of the hyperinsulinemic-euglycemic clamp studies. H: Serum FFA concentrations. Data are presented as means ± SEM of 10 rats per group. *P < 0.05 vs. DIO. **P < 0.001 vs. DIO.
FIG. 6.
FIG. 6.
Effects of acute exercise on the TLR4 pathway. Representative blots show the TLR4/MyD88 interaction in muscle (A), liver (B), and adipose (C) of control, DIO, DIO+AE2h, and DIO+AE16h rats (top). Total protein expression of MyD88 and TLR4 (A–C, bottom). Phosphorylation of IKKβ in muscle (D), liver (E), and adipose (F) of control, DIO, DIO+AE2h, and DIO+AE16h rats (top). Total protein expression of IKKβ (D–F, bottom). Expression of JNK phosphorylation in muscle (G), liver (H), and adipose (I) of control, DIO, DIO+AE2h, and DIO+AE16h rats (top). Total protein expression of JNK (G–I, bottom). IRS-1 serine 307 phosphorylation in muscle (J), liver (K), and adipose (L) of control, DIO, DIO+AE2h, and DIO+AE16h rats (top). Total protein expression of IRS-1 (J–L, bottom). Data are presented as means ± SE of 10 rats per group. #P < 0.05 vs. control group. *P < 0.05 vs. DIO. IB, immunoblot; IP, immunoprecipitate.
FIG. 7.
FIG. 7.
Effects of a single session of exercise on insulin signaling in high-fat fed rats. Representative blots show tyrosine phosphorylation of IRβ in muscle (A), liver (B), and adipose (C) of control, DIO, DIOACE2h, and DIO+AE16h rats (top). Total protein expression of IRβ (A–C, bottom). Tyrosine phosphorylation of IRS-1 in muscle (D), liver (E), and adipose (F) of control, DIO, DIO+AE2h, and DIO+AE16h rats (top). Total protein expression of IRS-1 (D–F, bottom). Serine phosphorylation of Akt in muscle (G), liver (H), and adipose (I) of control, DIO, DIO+AE2h, and DIO+AE16h rats (top). Total protein expression of Akt (G–I, bottom). Data are presented as means ± SE of 10 rats per group. #P < 0.05 vs. control group. *P < 0.05 vs. DIO. IB, immunoblot.
FIG. 8.
FIG. 8.
Serum LPS concentrations and influence of LPS challenge on the acute exercise effect in obese Wistar rats. A: Serum LPS levels in control, DIO, DIO+AE2h, DIO+AE16h, DIO+CE24h, and DIO+CE36h rats, and DIO+AE animals treated with LPS. Representative blots show the TLR4/MyD88 interaction in control, DIO, DIO+AE2h, and DIO+AE16h rats treated with saline or LPS in muscle (B) and adipose (C). Total protein expression of MyD88 (B–C, bottom). Phosphorylation of IKKβ in muscle (D) and adipose (E) of DIO+AE2h and DIO+AE16h rats with saline or LPS (top). Total protein expression of IKKβ (D–E, bottom). Expression of JNK phosphorylation in muscle (F) and adipose (G) of DIO+AE2h and DIO+AE16h rats treated with saline or LPS (top). Total protein expression of JNK (F–G, bottom). Serine phosphorylation of Akt in muscle (H) and adipose (I) in control, DIO, DIO+AE2h, and DIO+AE16h rats treated with saline or LPS (top). Total protein expression of Akt (H–I, bottom). Data are presented as means ± SE of 10 rats per group. #P < 0.05 vs. control group. ##P < 0.001 vs. control group. *P < 0.05 vs. DIO. **P < 0.001 vs. DIO. &P < 0.001 vs. DIO+AE2h. $P < 0.001 vs. DIO+AE16h. IB, immunoblot; IP, immunoprecipitate.

References

    1. Weisberg SP, McCann D, Desai M, Rosenbaum M, Leibel RL, Ferrante AW., Jr Obesity is associated with macrophage accumulation in adipose tissue. J Clin Invest 2003;112:1796–1808 - PMC - PubMed
    1. Hotamisligil GS. Inflammation and metabolic disorders. Nature 2006;444:860–867 - PubMed
    1. Shoelson SE, Herrero L, Naaz A. Obesity, inflammation, and insulin resistance. Gastroenterology 2007;132:2169–2180 - PubMed
    1. Schenk S, Saberi M, Olefsky JM. Insulin sensitivity: modulation by nutrients and inflammation. J Clin Invest 2008;118:2992–3002 - PMC - PubMed
    1. Song MJ, Kim KH, Yoon JM, Kim JB. Activation of Toll-like receptor 4 is associated with insulin resistance in adipocytes. Biochem Biophys Res Commun 2006;346:739–745 - PubMed

Publication types

MeSH terms