. 2011 Jan;23(1):111-29.
doi: 10.1105/tpc.109.073692. Epub 2011 Jan 31.

Pollen semi-sterility1 encodes a kinesin-1-like protein important for male meiosis, anther dehiscence, and fertility in rice

Affiliations

Pollen semi-sterility1 encodes a kinesin-1-like protein important for male meiosis, anther dehiscence, and fertility in rice

Shirong Zhou et al. Plant Cell. 2011 Jan.

Abstract

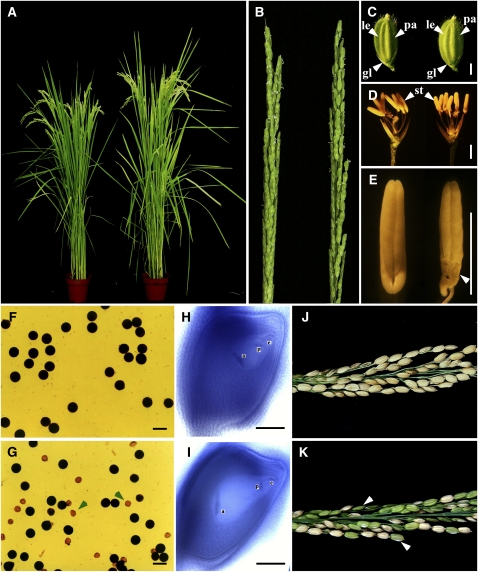
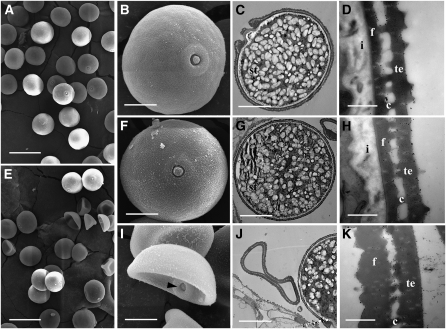
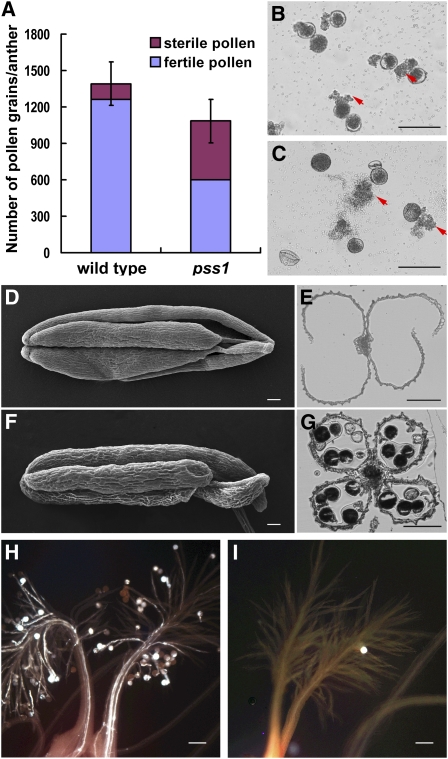
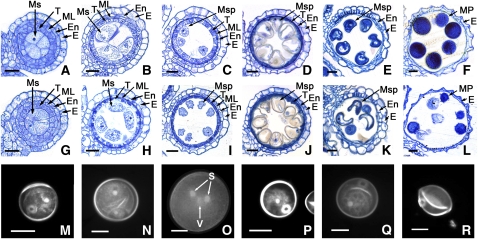
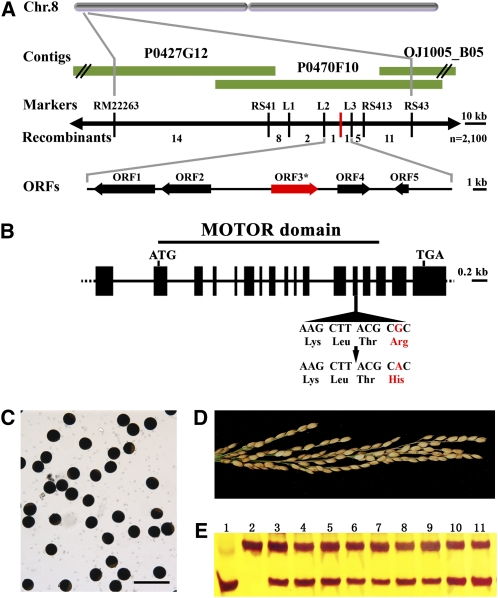
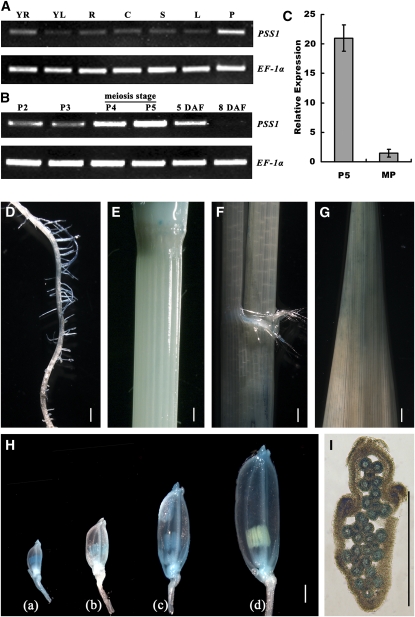
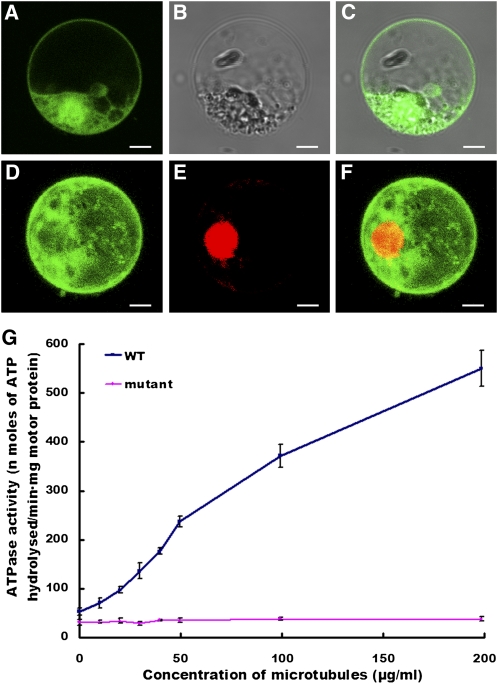
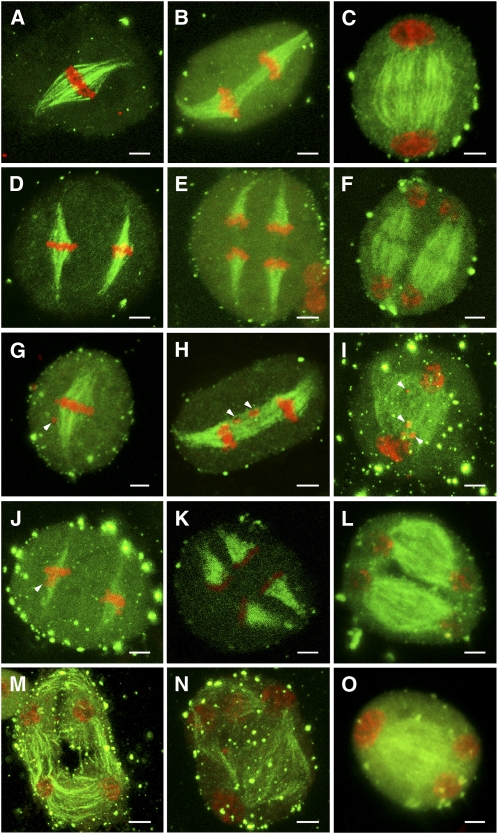
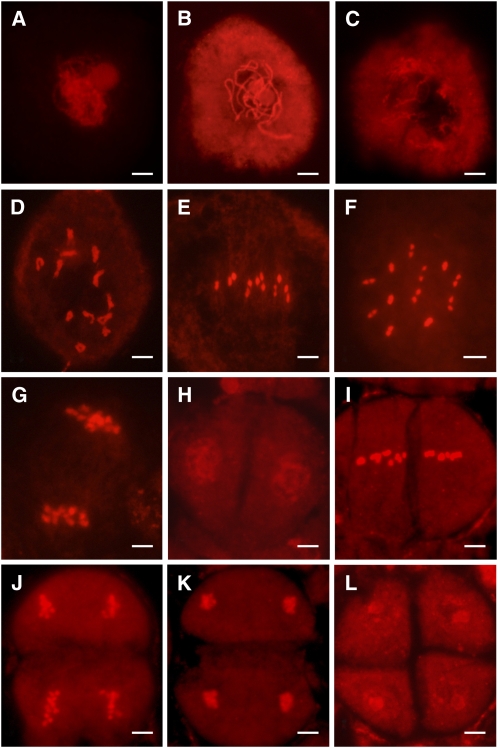
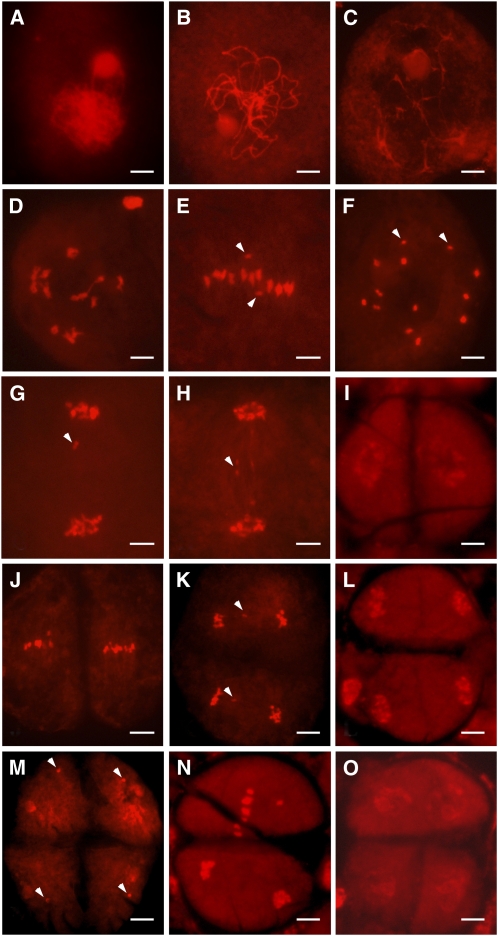
In flowering plants, male meiosis produces four microspores, which develop into pollen grains and are released by anther dehiscence to pollinate female gametophytes. The molecular and cellular mechanisms regulating male meiosis in rice (Oryza sativa) remain poorly understood. Here, we describe a rice pollen semi-sterility1 (pss1) mutant, which displays reduced spikelet fertility (~40%) primarily caused by reduced pollen viability (~50% viable), and defective anther dehiscence. Map-based molecular cloning revealed that PSS1 encodes a kinesin-1-like protein. PSS1 is broadly expressed in various organs, with highest expression in panicles. Furthermore, PSS1 expression is significantly upregulated during anther development and peaks during male meiosis. The PSS1-green fluorescent protein fusion is predominantly localized in the cytoplasm of rice protoplasts. Substitution of a conserved Arg (Arg-289) to His in the PSS1 motor domain nearly abolishes its microtubule-stimulated ATPase activity. Consistent with this, lagging chromosomes and chromosomal bridges were found at anaphase I and anaphase II of male meiosis in the pss1 mutant. Together, our results suggest that PSS1 defines a novel member of the kinesin-1 family essential for male meiotic chromosomal dynamics, male gametogenesis, and anther dehiscence in rice.


Figures

Figure 1.
Figure 1.
Phenotypic Analyses of the pss1 Mutant. (A) The pss1 mutant (right) is almost normal except it is a little taller and earlier heading than the wild-type plant (left) after bolting. (B) The pss1 mutant has a normal panicle (right) compared with the wild type (left). (C) The pss1 mutant spikelet (right) appears to be normal compared with the wild type (left) at bolting stage. (D) Comparison of a wild-type (left) and a pss1 mutant spikelet (right) after removing the lemma and palea. (E) Comparison of a wild-type (left) and a pss1 mutant anther (right). The basal part of the mutant anther is shriveled (arrowhead). (F) KI-I2 staining of wild-type pollen. (G) KI-I2 staining of pss1 mutant pollen. Arrowheads indicate abnormal pollen grains. (H) and (I) Comparison of a mature wild-type embryo sac (H) and a mature mutant embryo sac (I) observed by the whole-mount stain-clearing confocal laser scanning microscopy method. (J) and (K) Comparison of a wild-type panicle (J) and a pss1 mutant panicle (K) at the harvest stage. The spikelet fertility of the mutant is ~40%. Arrowheads indicate the sterile spikelets. le, lemma; pa, palea; gl, glume; st, stamen; a, antipodal cells; p, polar nuclei; e, egg cell. Bars = 2 mm in (C) to (E) and 50 μm in (F) to (I).
Figure 2.
Figure 2.
Scanning Electron Microscopy and Transmission Electron Microscopy Examination of Wild-Type and pss1 Mutant Pollen. (A) Scanning electron microscopy image of mature wild-type pollen grains. (B) A higher magnification image of a single pollen grain from (A). (C) Transmission electron microscopy image showing that the wild-type pollen grain contains a large number of starch granules. (D) A higher magnification image of the pollen wall from (C). (E) Scanning electron microscopy image showing the two types of pollen grains in the pss1 mutant. (F) A higher magnification image of the normal-shaped pollen grain from (E). (G) Transmission electron microscopy image of a normal-shaped pss1 mutant pollen grain. (H) A higher magnification image of the pollen wall from (G). (I) A higher magnification image of an abnormal-shaped pollen grain from (E). Arrowhead indicates the germination pore. (J) Transmission electron microscopy image showing that there is no accumulations of starch granules in the abnormal-shaped pss1 mutant pollen grain. (K) A higher magnification transmission electron microscopy image of the pollen wall from (J), which lacks intine and has abnormal exine. st, starch granules; i, intine; f, foot layer; c, columella; te, tectum. Bars = 50 μm in (A) and (E), 10 μm in (B), (C), (F), (G), (I), and (J), and 500 nm in (D), (H), and (K).
Figure 3.
Figure 3.
Fertility Analysis of the pss1 Mutant. (A) Quantification of the total pollen grain numbers in the wild type and the pss1 mutant anthers. The pollen grain number of the mutant is ~78% of the wild type, and the fertile pollen grain number is ~40% of the wild type. Error bars indicate sd of total pollen grains from five independent samples. (B) and (C) In vitro germination of the wild-type (B) and the pss1 mutant (C) pollen. The normal-shaped pollen in the mutant can germinate normally. Arrows indicate pollen tubes. (D) to (G) Comparison of anther dehiscence between the wild type and the pss1 mutant. (D) and (F), scanning electron microscopy images of the wild-type (D) and mutant (F) anthers after anthesis; (E) and (G), cross sections of the wild-type (E) and mutant (G) anthers after anthesis. The mutant anther cannot dehisce normally. (H) and (I) Comparison of pollen grain number on the stigma between the wild type (H) and the pss1 mutant (I). There are only few pollen grains on the mutant stigma. Bars = 100 μm.
Figure 4.
Figure 4.
Comparison of Male Gametogenesis in the Wild Type and the pss1 Mutant. (A) to (F) and (M) to (O) show the wild type; (G) to (L) and (P) to (R) show the pss1 mutant. The cross sections ([A] to [L]) are stained with 0.25% toluidine blue O. E, epidermis; En, endothecium; ML, middle layer; Ms, microsporocyte; Msp, microspore; MP, mature pollen; S, sperm nuclei; T, tapetum; V, vegetative nuclei. Bars = 15 μm. (A) and (G) Cross section of single locule at the microspore mother cell stage. (B) and (H) Cross section of single locule at the meiosis stage. (C) and (I) Cross section of single locule at the young microspore stage. (D) and (J) Cross section of single locule at the vacuolated pollen stage. (E) and (K) Cross section of single locule at the pollen mitosis stage showing two types of pollen grains in the mutant locule. (F) and (L) Cross section of single locule at the mature pollen stage showing two types of pollen grains in the mutant locule. (M) and (P) DAPI staining of a uninucleate stage microspore. (N) and (Q) DAPI staining of a bicellular stage microspore. (O) and (R) DAPI staining of a tricellular stage microspore.
Figure 5.
Figure 5.
Positional Cloning of PSS1. (A) Fine mapping of the PSS1 gene on chromosome 8. Names of the molecular markers and the number of recombinants are indicated (n = 2100). P0427G12, P0470F10, and OJ1005_B05 are PAC and BAC clones covering this locus. The PSS1 locus is mapped to a 27-kb region between the molecular markers L2 and L3. (B) A schematic representation of the gene structure of PSS1. The mutant sequence has a single nucleotide change from guanine (G) to adenine (A) in the 13th exon. The motor domain is indicated. ATG and TGA represent the start and stop codons, respectively. (C) and (D) A 7.6-kb wild-type genomic DNA fragment of PSS1 completely rescues the pollen (C) and spikelet (D) semisterility phenotypes of the pss1 mutant. Bar = 100 μm. (E) Molecular identification of T0 transgenic plants by a dCAPS marker. The bottom band represents the wild-type allele, and the top band represents the pss1 mutant allele. Lane 1, the wild type; lane 2, pss1 mutant; lanes 3 to 11, T0 transgenic plants.
Figure 6.
Figure 6.
Expression Analysis of the PSS1 Gene. (A) RT-PCR analysis showing that PSS1 is expressed in various organs. YR, young root; YL, young leaf; R, mature root; C, mature culm; S, mature sheath; L, mature leaf; P, panicle. (B) RT-PCR analysis showing that PSS1 expression peaks at P4 and P5 stages and decreases afterwards. P2 to P5, different developmental stages of young panicles. 5 DAF, panicles of 5 d after flowering; 8 DAF, panicles of 8 d after flowering. (C) Real-time PCR analysis showing that the expression of PSS1 in P5 stage is ~21-fold higher than that in the mature pollen stage. Error bars indicate sd of three independent samples. (D) to (G) Histochemical staining assay of PSS1 promoter–GUS reporter gene. Weak GUS signal is detected in root (D), culm (E), sheath (F), and leave blade (G). (H) In panicles, the GUS signal was initially limited to the anther, then appears in the other parts of florets (glume, lemma, and palea) as the panicle development progresses. (a) A 2-mm-long spikelet from P2 group panicles; (b) a 3-mm-long spikelet from P3 stage panicles; (c) a 5-mm-long spikelet from P5 stage panicles; (d) postmeiosis spikelet. (I) Cross section of P5 stage spikelet showing that GUS signal in anthers. Bars = 1 mm in (D) to (I).
Figure 7.
Figure 7.
Subcellular Localization and Microtubule-Stimulated ATPase Activity Assay of the PSS1 Protein. (A) to (C) GFP alone is detected in both the nucleus and cytoplasm of rice protoplast cells. (D) PSS1-GFP is predominantly detected in the cytoplasm. (E) Nuclear localization of RPBF-mCherry (a nuclear marker). (F) A merged image of (D) and (E). Bars = 5 μm. (G) Comparison of microtubule-stimulated ATPase activities of the wild type (WT) and PSS1 mutant proteins. Error bars indicate sd of three independent experiments.
Figure 8.
Figure 8.
Immunostaining of Spindles in Wild-Type and pss1 Male Meiocytes. Chromosomes are stained by propidium iodide (red), and microtubules are labeled by fluorescein isothiocyanate (green). Bars = 5 μm. (A) to (F) Male meiocytes of the wild type. (A) Bipolar-oriented spindle at metaphase I. (B) Two sets of univalents separated by the spindle at anaphase I. (C) Phragmoplast starts to form between the two daughter pronuclei at telophase I. The weak staining in the midzone indicates the formation of a cytokinetic plane. (D) Two sets of univalents aligned at the metaphase II plates. (E) Two sets of univalents are separated to the opposite poles by the anaphase II spindles. (F) At telophase II, new phragmoplast structure forms near the equatorial plate. (G) to (O) Male meiocytes of the pss1 mutant. (G) At metaphase I, the pss1 mutant shows normal-shaped spindles, but one or several chromosomes are delayed (indicated by arrowhead). (H) Bivalents are pulled by the forces of anaphase I spindles and move away from the equator. Delayed chromosomes are observed (indicated by arrowheads). (I) The telophase I spindle is somewhat disorganized compared with that of the wild type. In addition, delayed chromosomes are observed (indicated by arrowheads). (J) The metaphase II spindle has a normal shape but is thinner than that of the wild type. Delayed chromosomes can also be seen (indicated by arrowhead). (K) The shape and density of the anaphase II spindles are similar to that of the wild type. (L) Most meiocytes of pss1 mutant show normal shaped spindles at telophase II. (M) to (O) A small portion of meiocytes has disorganized microtubules and form atypical tetrads.
Figure 9.
Figure 9.
Chromosome Dynamics in Wild-Type Male Meiocytes. Chromosomes are stained with 0.1 mg/mL propidium iodide. Bars = 5 μm. (A) to (D) Zygotene (A), pachytene (B), diplotene (C), and diakinesis (D). (E) Metaphase I front view, showing 12 bivalents arranged at the equatorial plate. (F) Metaphase I polar view, showing 12 completely paired bivalents. (G) Anaphase I, showing synchronous separation of chromosomes to the opposite poles. (H) Telophase I. (I) Metaphase II. (J) Anaphase II. (K) Telophase II. (L) Normal tetrad in wild-type anthers.
Figure 10.
Figure 10.
Chromosome Dynamics in pss1 Mutant Male Meiocytes. Chromosomes are stained with 0.1 mg/mL propidium iodide. Bars = 5 μm. (A) to (D) Zygotene (A), pachytene (B), diplotene (C), and diakinesis (D). (E) Metaphase I front view, showing only 11 bivalents arranged at the equatorial plate and two isolated univalents (indicated by arrowheads). (F) Metaphase I polar view, showing 11 bivalents and two univalents (indicated by arrowheads). (G) Anaphase I. Arrowhead indicates the delayed univalents. (H) Anaphase I. Arrowhead indicates chromosome bridge. (I) Telophase I. (J) Metaphase II. (K) Anaphase II. Arrowheads indicate the delayed univalents. (L) Telophase II. (M) pss1 forms micronuclei (indicated by arrowheads) at the tetrad stage. (N) Abnormal anaphase II. (O) Abnormal tetrad in the pss1 mutant.

References

    1. Armstrong S.J., Caryl A.P., Jones G.H., Franklin F.C. (2002). Asy1, a protein required for meiotic chromosome synapsis, localizes to axis-associated chromatin in Arabidopsis and Brassica. J. Cell Sci. 115: 3645–3655 - PubMed
    1. Brady S.T., Pfister K.K., Bloom G.S. (1990). A monoclonal antibody against kinesin inhibits both anterograde and retrograde fast axonal transport in squid axoplasm. Proc. Natl. Acad. Sci. USA 87: 1061–1065 - PMC - PubMed
    1. Brar D.S., Khush G.S. (1997). Alien introgression in rice. Plant Mol. Biol. 35: 35–47 - PubMed
    1. Cardoso C.M., Groth-Pedersen L., Høyer-Hansen M., Kirkegaard T., Corcelle E., Andersen J.S., Jäättelä M., Nylandsted J. (2009). Depletion of kinesin 5B affects lysosomal distribution and stability and induces peri-nuclear accumulation of autophagosomes in cancer cells. PLoS ONE 4: e4424. - PMC - PubMed
    1. Caryl A.P., Armstrong S.J., Jones G.H., Franklin F.C. (2000). A homologue of the yeast HOP1 gene is inactivated in the Arabidopsis meiotic mutant asy1. Chromosoma 109: 62–71 - PubMed

Publication types

MeSH terms

LinkOut - more resources