. 2011 Feb 15;108(7):2825-30.
doi: 10.1073/pnas.1008895108. Epub 2011 Jan 31.

Role of social networks in shaping disease transmission during a community outbreak of 2009 H1N1 pandemic influenza

Collaborators, Affiliations

Role of social networks in shaping disease transmission during a community outbreak of 2009 H1N1 pandemic influenza

Simon Cauchemez et al. Proc Natl Acad Sci U S A. .

Abstract

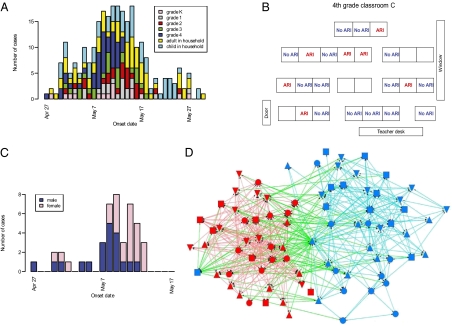
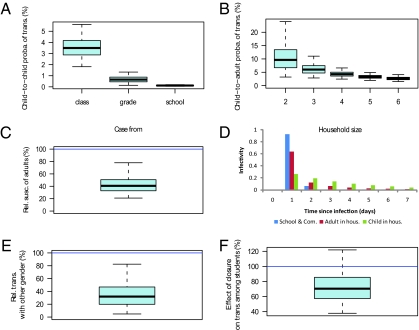
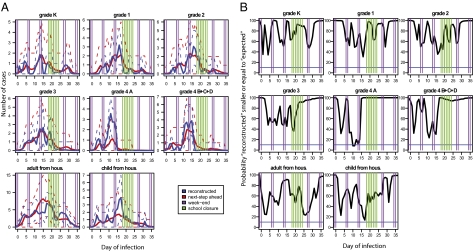
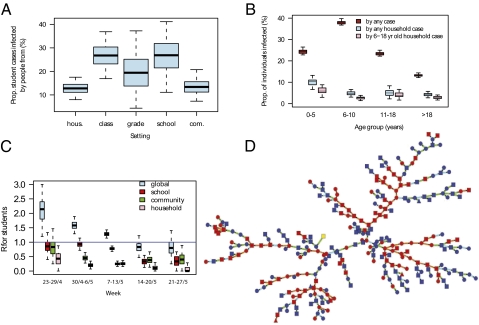
Evaluating the impact of different social networks on the spread of respiratory diseases has been limited by a lack of detailed data on transmission outside the household setting as well as appropriate statistical methods. Here, from data collected during a H1N1 pandemic (pdm) influenza outbreak that started in an elementary school and spread in a semirural community in Pennsylvania, we quantify how transmission of influenza is affected by social networks. We set up a transmission model for which parameters are estimated from the data via Markov chain Monte Carlo sampling. Sitting next to a case or being the playmate of a case did not significantly increase the risk of infection; but the structuring of the school into classes and grades strongly affected spread. There was evidence that boys were more likely to transmit influenza to other boys than to girls (and vice versa), which mimicked the observed assortative mixing among playmates. We also investigated the presence of abnormally high transmission occurring on specific days of the outbreak. Late closure of the school (i.e., when 27% of students already had symptoms) had no significant impact on spread. School-aged individuals (6-18 y) facilitated the introduction and spread of influenza in households, but only about one in five cases aged >18 y was infected by a school-aged household member. This analysis shows the extent to which clearly defined social networks affect influenza transmission, revealing strong between-place interactions with back-and-forth waves of transmission between the school, the community, and the household.


Conflict of interest statement

Conflict of interest statement: S.C. received consulting fees from Sanofi Pasteur MSD on a project on the modeling of the transmission of varicella zoster virus.

Figures

Fig. 1.
Fig. 1.
Epidemiological data collected in the school. (A) Number of acute respiratory illness (ARI) cases by date of symptom onset for different types of individuals. (B–D) Survey of fourth graders with (B) seating charts and diagnosis for ARI in classroom C, (C) number of ARI cases by date of symptom onset and sex among fourth graders, and (D) social networking among fourth graders based on the question “Who are your playmates?” [color of the nodes, red, female; blue, male; color of the lines, red, girl–girl interaction; cyan, boy–boy interaction; green, boy–girl interaction (one symbol shape per class)]. The algorithm used to draw the network aims at (i) distributing nodes evenly, (ii) making edge length uniform, (iii) minimizing edge crossings, and (iv) keeping nodes from coming too close to edges (32, 33) (software: Netdraw). It does not use data on sex to position the nodes.
Fig. 2.
Fig. 2.
Estimated transmission risk factors and generation times in places. (A) Transmission probability from an infected student to a classmate, to a student from the same grade but a different class, and to a student from a different grade during his/her infectious period. (B) Transmission probability in the household from an infected child to an adult of the household during his/her infectious period, as a function of household size. (C) Susceptibility of adults relative to children (≤10 y old), ρadult. (D) Generation time in the school/community, in the household for adults and children. (E) Transmission to children from the other sex relative to that to children from the same sex, ρsex. (F) Transmission between students during school closure relative to that during the rest of the outbreak, ρSC. Boxplots give percentiles 2.5%, 25%, 50%, 75%, and 97.5% of the posterior distribution. The mathematical definition of parameters is given in SI Materials and Methods.
Fig. 3.
Fig. 3.
Detection of abnormal transmission events in the different groups of individuals. (A) “Reconstructed” numbers of infections per day for different groups of individuals (blue line) along with the “next-step ahead” predictions giving for each day t the number of infections predicted by the model given what has happened up to day t − 1 (red line). Dashed lines give the 95% CI. The different groups of individuals are students from grades K, 1, 2, and 3 and fourth graders from classroom A and from other classrooms (classrooms B, C, and D) and adult and child household contacts. (B) For each day and each group, the posterior probability that the reconstructed number of infections is smaller or equal to the “next-step ahead” predictions. The blue line gives the 10% limit below which adequacy is rejected. See Materials and Methods and SI Materials and Methods for details.
Fig. 4.
Fig. 4.
Reconstruction of the transmission tree. (A) Proportion of student cases infected by people from their household, class, grade, school, or from the community. (B) Proportion of individuals infected by any other case (red), by any household case (blue), or by a household case aged 6–18 y (pink), as a function of the age of the individual. (C) Weekly estimates of the effective reproduction number in the outbreak (“global” R) and in places (school, household, and community). (D) Reconstructed transmission tree drawn from its predictive distribution (color of the nodes, yellow, first case; red, student of the school; blue, household member of a student; color of the lines for the type of transmission, orange, among students of the school; light blue, among household members; green, in the community; shape of the nodes, circle, female; square, male; triangle, sex is missing). Boxplots give percentiles 2.5%, 25%, 50%, 75%, and 97.5% of the predictive distribution.

References

    1. Ferguson NM, et al. Strategies for containing an emerging influenza pandemic in Southeast Asia. Nature. 2005;437:209–214. - PubMed
    1. Ferguson NM, et al. Strategies for mitigating an influenza pandemic. Nature. 2006;442:448–452. - PMC - PubMed
    1. Germann TC, Kadau K, Longini IM, Jr., Macken CA. Mitigation strategies for pandemic influenza in the United States. Proc Natl Acad Sci USA. 2006;103:5935–5940. - PMC - PubMed
    1. Longini IM, Jr, et al. Containing pandemic influenza at the source. Science. 2005;309:1083–1087. - PubMed
    1. Eubank S, et al. Modelling disease outbreaks in realistic urban social networks. Nature. 2004;429:180–184. - PubMed

Publication types