. 2011 Feb 1:7:464.
doi: 10.1038/msb.2010.122.

Comprehensive quantitative analysis of central carbon and amino-acid metabolism in Saccharomyces cerevisiae under multiple conditions by targeted proteomics

Affiliations

Comprehensive quantitative analysis of central carbon and amino-acid metabolism in Saccharomyces cerevisiae under multiple conditions by targeted proteomics

Roeland Costenoble et al. Mol Syst Biol. .

Abstract

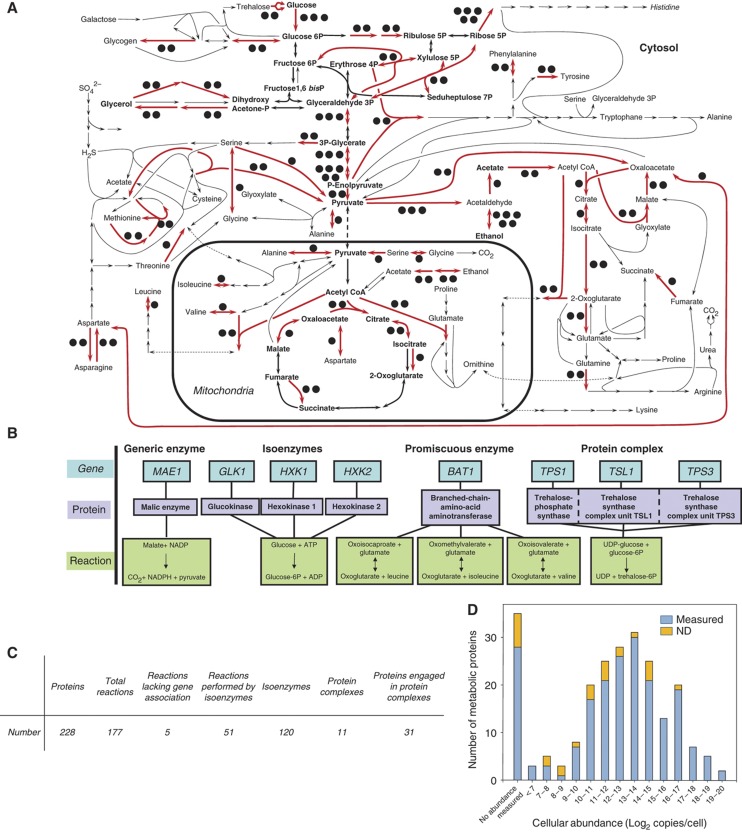
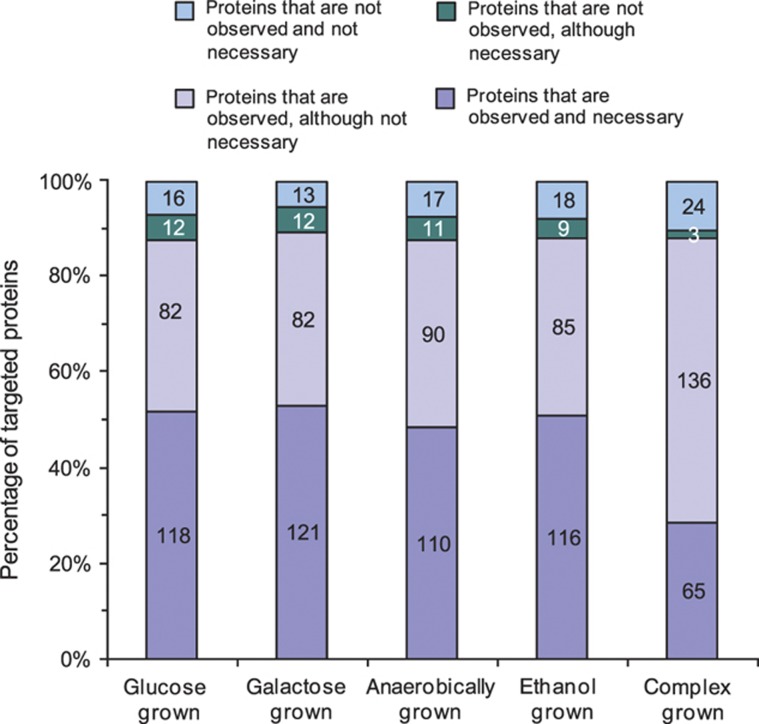
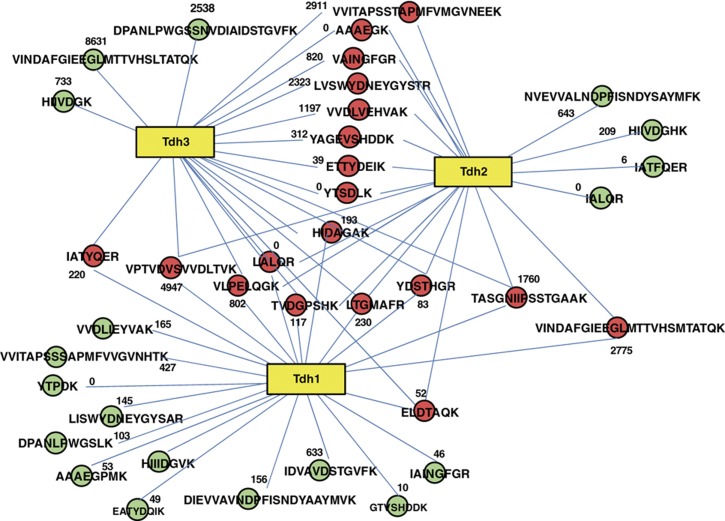
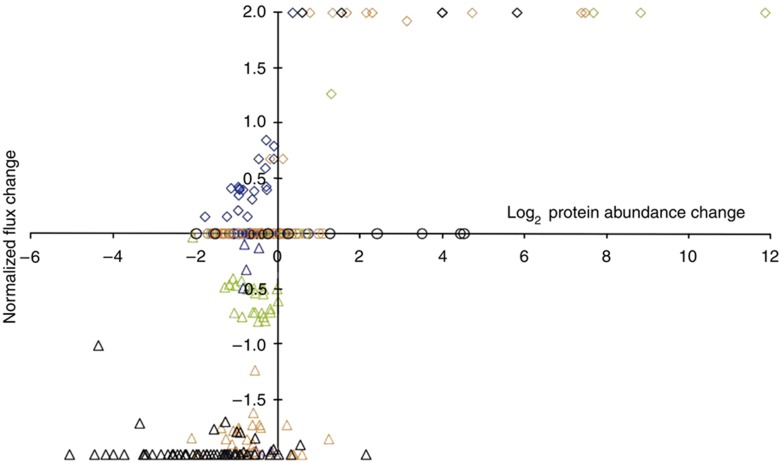
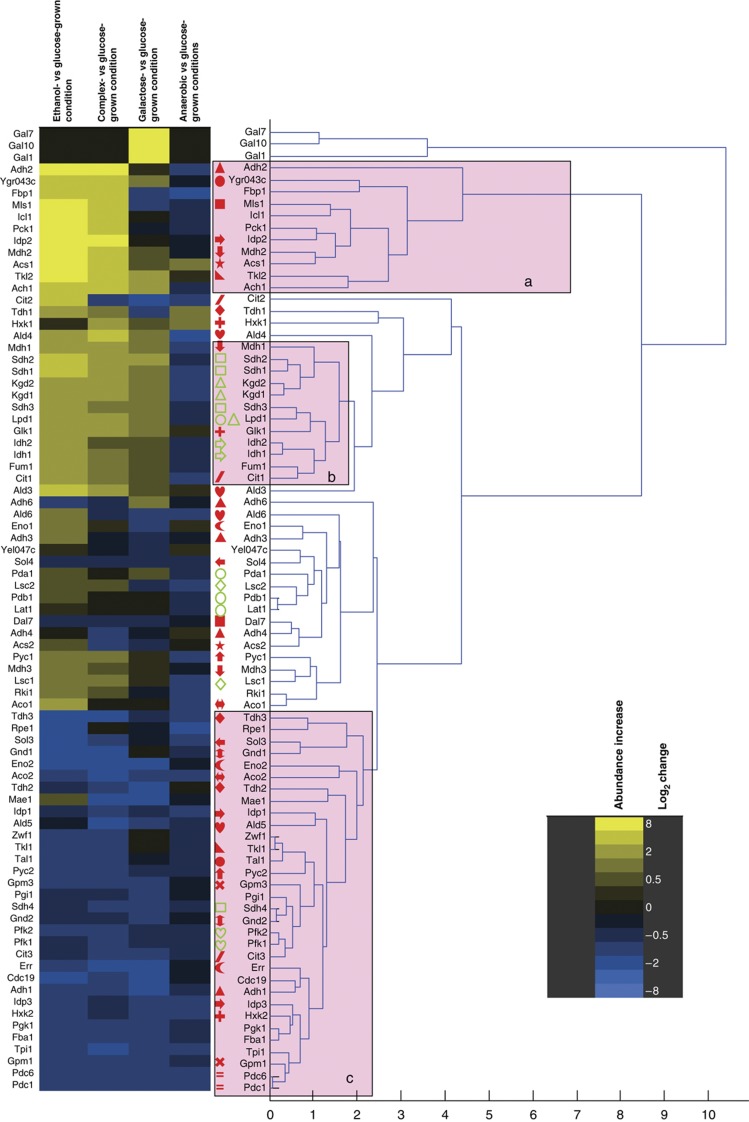
Decades of biochemical research have identified most of the enzymes that catalyze metabolic reactions in the yeast Saccharomyces cerevisiae. The adaptation of metabolism to changing nutritional conditions, in contrast, is much less well understood. As an important stepping stone toward such understanding, we exploit the power of proteomics assays based on selected reaction monitoring (SRM) mass spectrometry to quantify abundance changes of the 228 proteins that constitute the central carbon and amino-acid metabolic network in the yeast Saccharomyces cerevisiae, at five different metabolic steady states. Overall, 90% of the targeted proteins, including families of isoenzymes, were consistently detected and quantified in each sample, generating a proteomic data set that represents a nutritionally perturbed biological system at high reproducibility. The data set is near comprehensive because we detect 95-99% of all proteins that are required under a given condition. Interpreted through flux balance modeling, the data indicate that S. cerevisiae retains proteins not necessarily used in a particular environment. Further, the data suggest differential functionality for several metabolic isoenzymes.


Conflict of interest statement

The authors declare that they have no conflict of interest.

Figures

Figure 1
Figure 1
The targeted network of central carbon and amino-acid metabolism of S. cerevisiae. (A) Schematic representation of the network. Reactions indicated with red arrows can be catalyzed by isoenzymes and the black dots indicate the number of isoenzymes (Supplementary Table 1). Bold, central carbon metabolism. (B) Four classes of gene–protein-reaction relations in the metabolic network. (C) Characteristic numbers for the considered network. (D) Distribution of cellular abundances for the proteins in central metabolism of S. cerevisiae, as derived from antibody-based expression data (Ghaemmaghami et al, 2003). The left most bar (‘no abundance measured’) represents 35 proteins whose abundance could not be determined in that study. ND, not detected in this study.
Figure 2
Figure 2
Comparison of protein necessity and presence. Protein necessity under each of the five tested conditions was determined by flux balance analysis through minimization of the Euclidean norm of intracellular fluxes on the basis of the physiological data (Table I). The numbers on the bars indicate amounts of proteins in each class.
Figure 3
Figure 3
Example of proteolytic pattern complexity for isoenzymes. Tryptic peptides for three isoenzymes of glyceraldehyde-3-phosphate dehydrogenase are shown as connected circles. Red circles indicate peptides shared by at least two of the three isoenzymes. Green circles indicate peptides unique to one isoenzyme. Numbers indicate the number of observations of the peptide in the PeptideAtlas database (S. cerevisiae build, 2009).
Figure 4
Figure 4
Correlation of FBA-calculated normalized flux changes with protein abundance changes for the four condition comparisons. Normalized flux changes were calculated using the following formula: (flux A−flux B)/((flux A+flux B)/2), where ‘flux A’ is the flux calculated for condition A, and ‘flux B’ the flux for the same reaction under the reference condition. Data are presented for the comparison of the galactose- (green), anaerobically (blue), ethanol- (red) and complex-grown condition (black) with the aerobic glucose-grown condition. The maximum normalized flux change of 2 (or −2) represents a change from zero in one condition to any magnitude. Fluxes involving promiscuous enzymes, isoenzymes and protein complexes were excluded from the analysis.
Figure 5
Figure 5
Hierarchical clustering analysis of abundance changes in the proteins of central carbon metabolism. Pink boxes indicate branches containing mainly proteins of ‘a’ gluconeogenesis and glyoxylate shunt; ‘b’ tricarboxylic acid cycle and ‘c’ glycolysis, ethanol formation and the pentose phosphate pathway. Isoenzyme families are indicated by identical, closed, red symbols before the protein name; proteins engaged in a protein complex are indicated by identical, open, green symbols. The heat map on the left indicates the direction and magnitude of the abundance changes for each listed protein.

References

    1. Addona TA, Abbatiello SE, Schilling B, Skates SJ, Mani DR, Bunk DM, Spiegelman CH, Zimmerman LJ, Ham AJ, Keshishian H, Hall SC, Allen S, Blackman RK, Borchers CH, Buck C, Cardasis HL, Cusack MP, Dodder NG, Gibson BW, Held JM et al. (2009) Multi-site assessment of the precision and reproducibility of multiple reaction monitoring-based measurements of proteins in plasma. Nat Biotechnol 27: 633–641 - PMC - PubMed
    1. Aldridge BB, Burke JM, Lauffenburger DA, Sorger PK (2006) Physicochemical modelling of cell signalling pathways. Nat Cell Biol 8: 1195–1203 - PubMed
    1. Anderson L, Hunter CL (2006) Quantitative mass spectrometric multiple reaction monitoring assays for major plasma proteins. Mol Cell Proteomics 5: 573–588 - PubMed
    1. Baty JD, Robinson PR (1977) Single and multiple ion recording techniques for the analysis of diphenylhydantoin and its major metabolite in plasma. Biomed Mass Spectrom 4: 36–41 - PubMed
    1. Bell AW, Deutsch EW, Au CE, Kearney RE, Beavis R, Sechi S, Nilsson T, Bergeron JJ (2009) A HUPO test sample study reveals common problems in mass spectrometry-based proteomics. Nat Methods 6: 423–430 - PMC - PubMed

Publication types

MeSH terms