. 2011 Jan 19;6(1):e15767.
doi: 10.1371/journal.pone.0015767.

Metabolic impact of adult-onset, isolated, growth hormone deficiency (AOiGHD) due to destruction of pituitary somatotropes

Affiliations

Metabolic impact of adult-onset, isolated, growth hormone deficiency (AOiGHD) due to destruction of pituitary somatotropes

Raul M Luque et al. PLoS One. .

Abstract

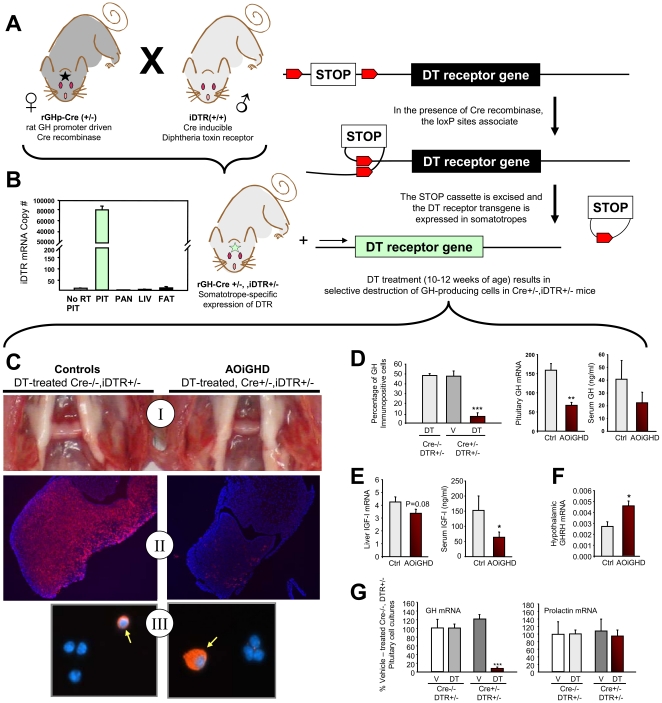
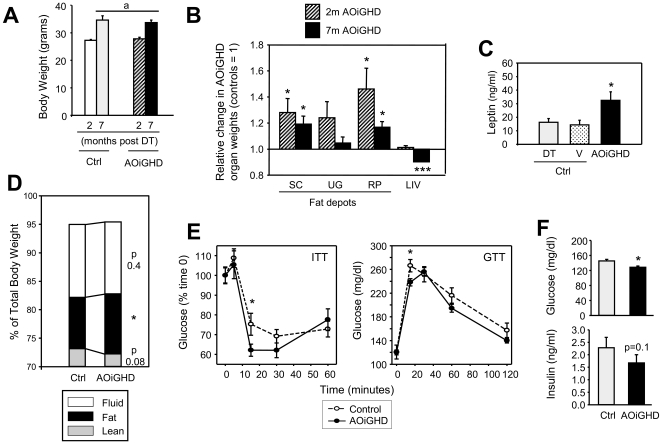
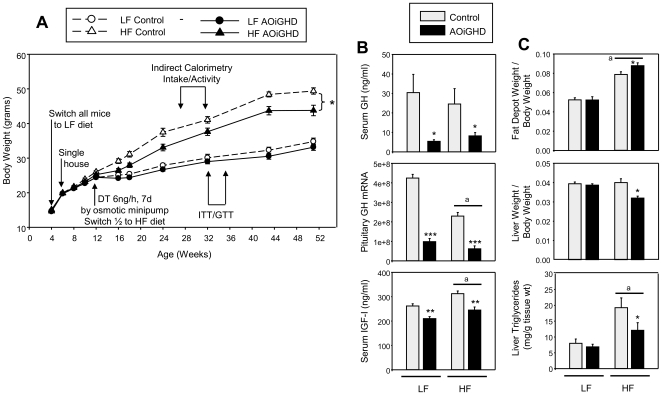
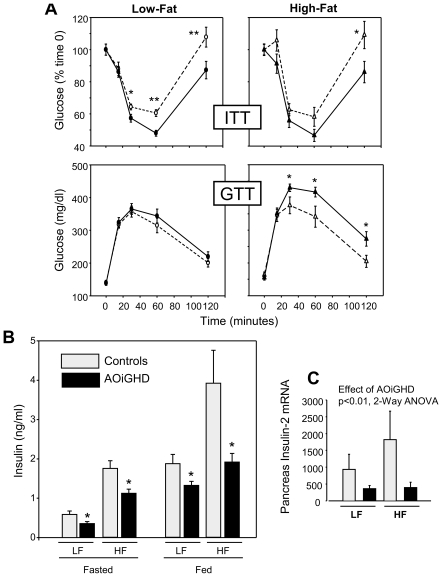
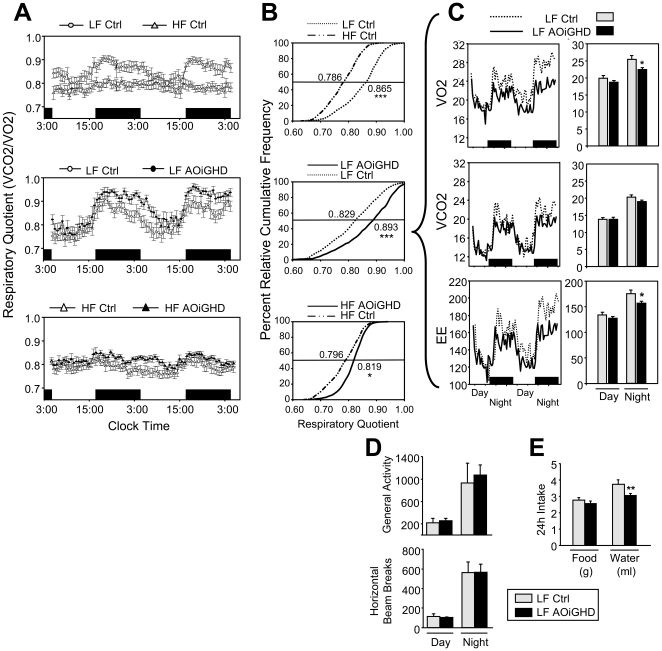
Growth hormone (GH) inhibits fat accumulation and promotes protein accretion, therefore the fall in GH observed with weight gain and normal aging may contribute to metabolic dysfunction. To directly test this hypothesis a novel mouse model of adult onset-isolated GH deficiency (AOiGHD) was generated by cross breeding rat GH promoter-driven Cre recombinase mice (Cre) with inducible diphtheria toxin receptor mice (iDTR) and treating adult Cre(+/-),iDTR(+/-) offspring with DT to selectively destroy the somatotrope population of the anterior pituitary gland, leading to a reduction in circulating GH and IGF-I levels. DT-treated Cre(-/-),iDTR(+/-) mice were used as GH-intact controls. AOiGHD improved whole body insulin sensitivity in both low-fat and high-fat fed mice. Consistent with improved insulin sensitivity, indirect calorimetry revealed AOiGHD mice preferentially utilized carbohydrates for energy metabolism, as compared to GH-intact controls. In high-fat, but not low-fat fed AOiGHD mice, fat mass increased, hepatic lipids decreased and glucose clearance and insulin output were impaired. These results suggest the age-related decline in GH helps to preserve systemic insulin sensitivity, and in the context of moderate caloric intake, prevents the deterioration in metabolic function. However, in the context of excess caloric intake, low GH leads to impaired insulin output, and thereby could contribute to the development of diabetes.


Conflict of interest statement

Competing Interests: The authors have declared that no competing interests exist.

Figures

Figure 1
Figure 1. Design and validation of the AOiGHD mouse model.
(A) rGHp-Cre and iDTR transgenic mice were crossbred to generate mice that express the DTR in the GH-producing cells (somatotropes) of the anterior pituitary gland, (B) Analysis of DTR mRNA copy number in pituitary (PIT), pancreas (PAN), liver (LIV) and adipose tissue (FAT) from Cre+/−,DTR+/− mice (without DT treatment) reveals that DTR is expressed only in the pituitary (other tissues tested [but not shown] were muscle, spleen, brain, lung, kidney, skin, intestine, adrenal, testis, ovary), “No RT PIT” indicates PCR amplification of total pituitary mRNA which was not reversed transcribed. The tissue specific pattern of DTR mRNA matched that previously reported for Cre recombinase mRNA in rGHp-Cre Tg mice . Cre+/−,DTR+/− mice are normal until treated with DT, which results in the destruction of the somatotrope population. (C) Gross morphology (I) and GH immunofluorescence of pituitary cross-sections (II) and enzymatically dispersed pituitary cells (III) from DT-treated Cre−/−,DTR+/− mice (controls, left panels) and DT-treated Cre+/−,DTR+/− mice (AOiGHD, right panels). GH immuno-positive cells appear red and cell nuclei appear blue (II and III). Somatotropes from DT treated Cre+/−,DTR+/− mice are enlarged, relative to DT treated controls (III arrows). (D) Percentage of GH immuno-positive cells in pituitaries from DT-treated Cre−/−,iDTR+/− mice and vehicle (V)- and DT-treated Cre+/−,DTR+/− mice (left), and pituitary GH mRNA (middle) and circulating GH (right), in DT-treated control and AOiGHD mice. (E) Liver IGF-I mRNA (left) and circulating total IGF-I (right). (F) Hypothalamic expression of GHRH. Analysis of circulating hormones and tissue expression analysis were conducted 7 months post DT treatment. Hormone mRNA copy numbers were adjusted by HPRT mRNA copy number to control for total RNA reverse transcribed and the efficiency of the reaction. (G) Impact of in vitro vehicle- (V) and DT-treatment (10ng/ml for 24h) on GH and prolactin mRNA levels in primary pituitary cell cultures from adult Cre−/−,DTR+/− and Cre+/−,DTR+/− mice, where values are the means of 3 independent experiments. Panels C–F represent data collected after 2 months post-DT treatment with n = 8–12 mice/group. Asterisks indicate values that differ from controls, *, p<0.05, ** p<0.01, and *** p<0.001.
Figure 2
Figure 2. Impact of 2 to 7 months of AOiGHD on metabolic endpoints in male mice fed a standard rodent chow diet.
(A) Body weights (B) Relative fat depot (subcutaneous [SC], urogenital [UG], retroperitoneal [RP]) and liver (LIV) weight, of DT-treated Cre+/−,DTR+/− (AOiGHD) mice compared to DT-treated Cre−/−,DTR+/− controls set at 1. (C) Serum leptin levels measured 2 months post DT treatment in DT-treated Cre−/−,DTR+/− and vehicle-treated Cre+/−,DTR+/− mice (controls [ctrl]), compared to AOiGHD mice. (D) Percent total body weight of free fluid, fat and lean tissue weight measured by whole body NMR 2.5 months post DT treatment, using the MiniSpec LF50 (Bruker Optics, Germany). (E) Insulin tolerance tests (ITT, 0.75U/kg ip) and glucose tolerance tests (GTT, 2g/kg ip) conducted 2–3 months post DT treatment. (F) Glucose and insulin levels measured in serum samples (trunk blood) 7 month post DT treatment. Values are means +/− SEM, of n = 8–12 mice/group. Asterisks indicate values which significantly differ from controls, * p<0.05, *** P<0.001. a, indicates a significant effect of age (p<0.05), independent of GH status. Data presented in panels A–B and E–F are from AOiGHD and littermate controls, where DT was delivered by multiple ip injections, while data shown in panel D is from a separate set of mice (2.5 months post-DT treatment), where DT was delivered by osmotic minipump as described in Fig. 3. It should be noted that these metabolic endpoints did not differ between Cre+/−,DTR+/− and Cre−/−,DTR+/− mice not treated with DT, as shown in Fig. S1.
Figure 3
Figure 3. Optimized paradigm to generate AOiGHD mice and compare the impact of a high fat and low fat diet.
(A) Growth curves, (B) Circulating GH and IGF-I levels (from t0 GTT samples, Fig. 3A) and pituitary GH mRNA (copy number/0.05µg total RNA adjusted by a normalization factor of 3 separate housekeeping genes, see methods for details). (C) Fat depot (combined subcutaneous, urogenital and retroperitoneal fat pads) and liver weights adjusted by body weight and liver triglyceride content (mg/g tissue weight). Asterisks indicate values which significantly differ from controls, * p<0.05, ** p<0.01, *** P<0.001. “a” indicates significant impact of diet, independent of GH status (p<0.05). Values are means +/− SEM of n = 12–17 mice/group.
Figure 4
Figure 4. Impact of AOiGHD and diet on glucose homeostasis.
(A) Insulin tolerance tests (ITT, 1U/kg ip, top panels) and glucose tolerance tests (GTT, 1g/kg ip, bottom panels) in LF (left panels) and HF (right panels) fed AOiGHD (solid lines) and control (dotted lines) mice, performed at 5–6 months post DT treatment. (B) Insulin levels under fed and fasted (overnight) conditions, measured from tail vein blood samples collected at t0 in ITT and GTT, respectively. (C) Insulin-2 mRNA levels (copy number/0.05 µg total RNA adjusted by a normalization factor of 3 separate housekeeping genes, see methods for details). Asterisks indicate values which significantly differ from controls, * p<0.05, ** p<0.01. Values are means +/− SEM, of n = 8–17 mice/group.
Figure 5
Figure 5. Indirect calorimetry, activity and food/water intake.
(A) 48h profiles of respiratory quotient (RQ = VCO2 (ml/min/kg0.75) / VO2 (ml/min/kg0.75) where data was pooled from two separate runs using different mice in each run (n = 10 mice/group total). Comparisons were first made between LF- and HF-fed control mice to verify the accuracy of the gas monitoring system (top panel, 4 months post DT treatment), then AOiGHD mice were compared to controls within diet (LF, 5 months post DT treatment [middle panel] and HF, 5.5 months post DT-treatment [bottom panel]). (B) Percent relative cumulative frequency of 48h RQ values was calculated as reported by Riachi et al , and 50th percentile RQ values (values shown adjacent to each curves and demarcated by intercepts of the horizontal solid lines) were compared. (C) Left panels show the mean 48h profiles and right panels show the day and night averages of VO2, VCO2 and energy expenditure (EE, kcal/day/kg0.75) of LF-fed control vs. LF-fed AOiGHD mice conducted in a single run (n = 5 mice/group). (D) Impact of AOiGHD on day and night activity levels. (E) Impact of AOiGHD on 24h ad libitum food and water intake. Asterisks indicate values that differ from controls, *, p<0.05, ** p<0.01, and *** p<0.001.

References

    1. Giustina A, Veldhuis JD. Pathophysiology of the neuroregulation of growth hormone secretion in experimental animals and the human. Endocr Rev. 1998;19:717–797. - PubMed
    1. Scacchi M, Pincelli AI, Cavagnini F. Growth hormone in obesity. Int J Obes Relat Metab Disord. 1999;23:260–271. - PubMed
    1. Vijayyakumar A, Navosyadlyy R, Wu Y, Yakar S, LeRoith D. Biological effects of growth hormone on carbohydrate and lipid metabolism. Growth Horm IGF Res. 2009;20:1–7. - PMC - PubMed
    1. Attallah H, Friedlander AL, Hoffman AR. Visceral obesity, impaired glucose tolerance, metabolic syndrome, and growth hormone therapy. Growth Horm IGF Res. 2006;16:62–67. - PubMed
    1. Giovannini S, Marzetti E, Borst SE, Leeuwenburgh C. Modulation of GH/IGF-1 axis: Potential strategies to counteract sarcopenia in older adults. Mech Age Dev. 2008;129:593–601. - PMC - PubMed

Publication types

Substances