

Increased inducible nitric oxide synthase expression in organs is associated with a higher severity of H5N1 influenza virus infection
- PMID: 21283521
- PMCID: PMC3023712
- DOI: 10.1371/journal.pone.0014561
Increased inducible nitric oxide synthase expression in organs is associated with a higher severity of H5N1 influenza virus infection
Abstract
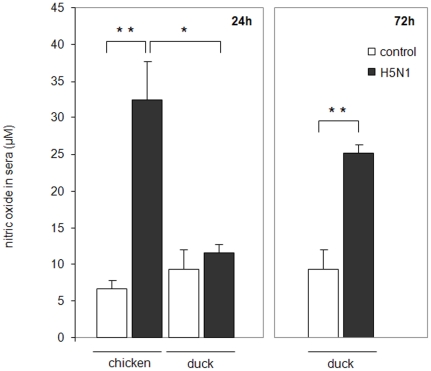
Background: The mechanisms of disease severity caused by H5N1 influenza virus infection remain somewhat unclear. Studies have indicated that a high viral load and an associated hyper inflammatory immune response are influential during the onset of infection. This dysregulated inflammatory response with increased levels of free radicals, such as nitric oxide (NO), appears likely to contribute to disease severity. However, enzymes of the nitric oxide synthase (NOS) family such as the inducible form of NOS (iNOS) generate NO, which serves as a potent anti-viral molecule to combat infection in combination with acute phase proteins and cytokines. Nevertheless, excessive production of iNOS and subsequent high levels of NO during H5N1 infection may have negative effects, acting with other damaging oxidants to promote excessive inflammation or induce apoptosis.
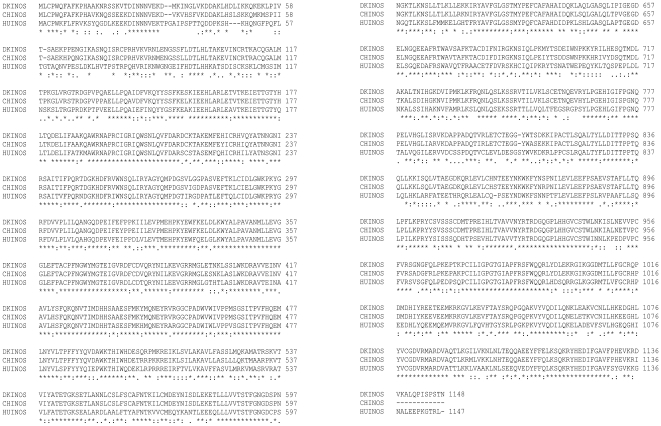
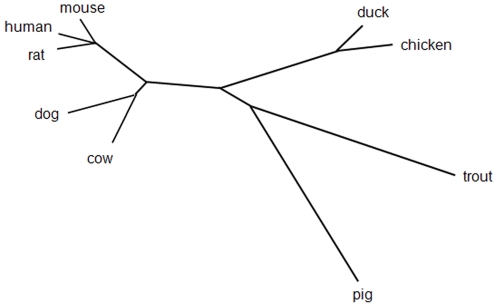
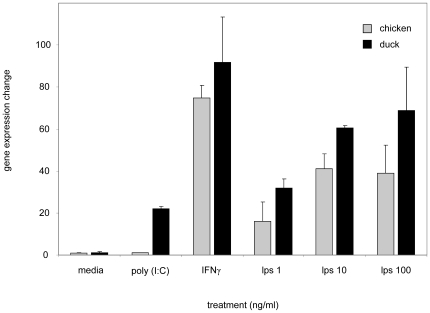
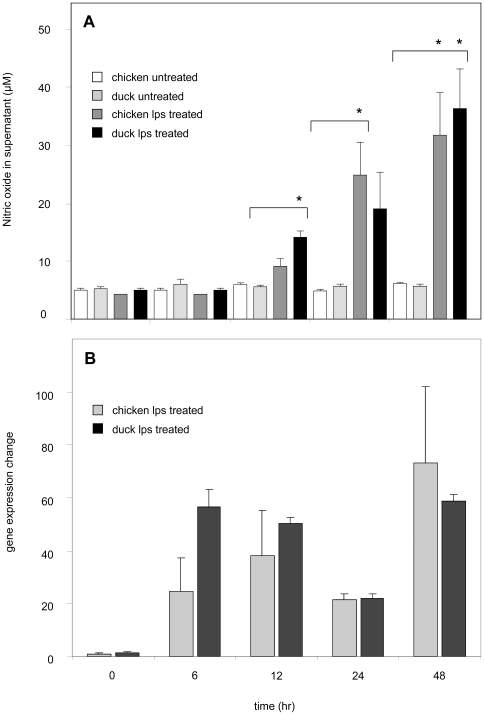
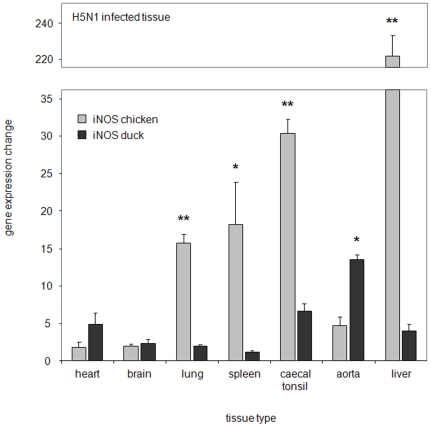
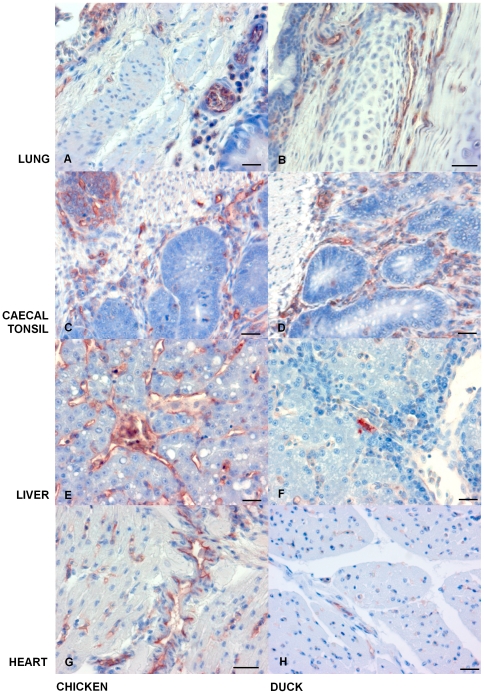
Methodology/principal findings: There are dramatic differences in the severity of disease between chickens and ducks following H5N1 influenza infection. Chickens show a high level of mortality and associated pathology, whilst ducks show relatively minor symptoms. It is not clear how this varying pathogenicty comes about, although it has been suggested that an overactive inflammatory immune response to infection in the chicken, compared to the duck response, may be to blame for the disparity in observed pathology. In this study, we identify and investigate iNOS gene expression in ducks and chickens during H5N1 influenza infection. Infected chickens show a marked increase in iNOS expression in a wide range of organs. Contrastingly, infected duck tissues have lower levels of tissue related iNOS expression.
Conclusions/significance: The differences in iNOS expression levels observed between chickens and ducks during H5N1 avian influenza infection may be important in the inflammatory response that contributes to the pathology. Understanding the regulation of iNOS expression and its role during H5N1 influenza infection may provide insights for the development of new therapeutic strategies in the treatment of avian influenza infection.
Conflict of interest statement
Figures
Similar articles
-
Highly pathogenic avian influenza virus infection in chickens but not ducks is associated with elevated host immune and pro-inflammatory responses.Vet Res. 2014 Nov 28;45(1):118. doi: 10.1186/s13567-014-0118-3. Vet Res. 2014. PMID: 25431115 Free PMC article.
-
H5N1 infection causes rapid mortality and high cytokine levels in chickens compared to ducks.Virus Res. 2014 Jun 24;185:23-31. doi: 10.1016/j.virusres.2014.03.012. Epub 2014 Mar 19. Virus Res. 2014. PMID: 24657784 Free PMC article.
-
Chicken and duck myotubes are highly susceptible and permissive to influenza virus infection.J Virol. 2015 Mar;89(5):2494-506. doi: 10.1128/JVI.03421-14. Epub 2014 Dec 24. J Virol. 2015. PMID: 25540384 Free PMC article.
-
Different routes of inoculation impact infectivity and pathogenesis of H5N1 high pathogenicity avian influenza virus infection in chickens and domestic ducks.Avian Dis. 2010 Dec;54(4):1260-9. doi: 10.1637/9397-051810-Reg.1. Avian Dis. 2010. PMID: 21313848
-
Ducks: the "Trojan horses" of H5N1 influenza.Influenza Other Respir Viruses. 2009 Jul;3(4):121-8. doi: 10.1111/j.1750-2659.2009.00084.x. Influenza Other Respir Viruses. 2009. PMID: 19627369 Free PMC article. Review.
Cited by
-
Nitric oxide synthase and its function in animal reproduction: an update.Front Physiol. 2023 Nov 7;14:1288669. doi: 10.3389/fphys.2023.1288669. eCollection 2023. Front Physiol. 2023. PMID: 38028794 Free PMC article. Review.
-
Innate Immune Genes Associated With Newcastle Disease Virus Load in Chick Embryos From Inbred and Outbred Lines.Front Microbiol. 2019 Jun 20;10:1432. doi: 10.3389/fmicb.2019.01432. eCollection 2019. Front Microbiol. 2019. PMID: 31281305 Free PMC article.
-
Reduced Nitric Oxide Synthase Involvement in Aigamo Duck Basilar Arterial Relaxation.Animals (Basel). 2023 Aug 28;13(17):2740. doi: 10.3390/ani13172740. Animals (Basel). 2023. PMID: 37685004 Free PMC article.
-
Transactivation of inducible nitric oxide synthase gene by Kruppel-like factor 6 regulates apoptosis during influenza A virus infection.J Immunol. 2012 Jul 15;189(2):606-15. doi: 10.4049/jimmunol.1102742. Epub 2012 Jun 18. J Immunol. 2012. PMID: 22711891 Free PMC article.
-
Novel Reassortant H5N6 Influenza A Virus from the Lao People's Democratic Republic Is Highly Pathogenic in Chickens.PLoS One. 2016 Sep 15;11(9):e0162375. doi: 10.1371/journal.pone.0162375. eCollection 2016. PLoS One. 2016. PMID: 27631618 Free PMC article.
References
-
- Isoda N, Sakoda Y, Kishida N, Bai GR, Matsuda K, et al. Pathogenicity of a highly pathogenic avian influenza virus, A/chicken/Yamaguchi/7/04 (H5N1) in different species of birds and mammals. Arch Virol. 2006;151:1267–79. - PubMed
-
- Nakamura K, Imada T, Imai K, Yamamoto Y, Tanimura N, et al. Pathology of specific-pathogen-free chickens inoculated with H5N1 avian influenza viruses isolated in Japan in 2004. Avian Dis. 2008;52:8–13. - PubMed
-
- Perkins LE, Swayne DE. Pathobiology of A/chicken/Hong Kong/220/97 (H5N1) avian influenza virus in seven gallinaceous species. Vet Pathol. 2001;38:149–64. - PubMed
-
- Mase M, Imada T, Nakamura K, Tanimura N, Imai K, et al. Experimental assessment of the pathogenicity of H5N1 influenza A viruses isolated in Japan. Avian Dis. 2005;49:582–4. - PubMed
-
- Pantin-Jackwood MJ, Swayne DE. Pathobiology of Asian highly pathogenic avian influenza H5N1 virus infections in ducks. Avian Dis. 2007;51:250–9. - PubMed
Publication types
MeSH terms
Substances
LinkOut - more resources
Full Text Sources
Medical
Research Materials
